How to Install Traefik via Azure Marketplace

If you're a developer or DevOps engineer looking to integrate Traefik Proxy and Traefik Enterprise with Azure Kubernetes Service (AKS), you're in the right place! This guide provides a simple and intuitive walkthrough on how to install Traefik Proxy and Traefik Enterprise through the Microsoft Azure Marketplace, granting you access to the many benefits of the Traefik product suite.
Traefik is one of the preferred choices for running an Ingress Controller and API Gateway on Azure. Recommended by Microsoft in their baseline architecture for Azure Kubernetes Service (AKS), Traefik offers dynamic configuration, middleware support, and seamless compatibility with AKS workloads.
Step-by-Step Instructions for Installing Traefik Proxy via Azure Marketplace
Before you get started, ensure that you have the following prerequisites:
- An active Azure subscription.
- An existing Azure Kubernetes Service (AKS) cluster.
- Helm installed on your local machine.
- Azure CLI installed on your machine (for cluster access).
After ensuring you meet the necessary prerequisites, you can move forward with the installation process:
1. First, navigate to Microsoft Azure Portal. Use the top search bar, search for Traefik Proxy, and click on the correspondent link under the Marketplace section.
2. Use the top search bar, search for Traefik Proxy, and click on the correspondent link under the Marketplace section.
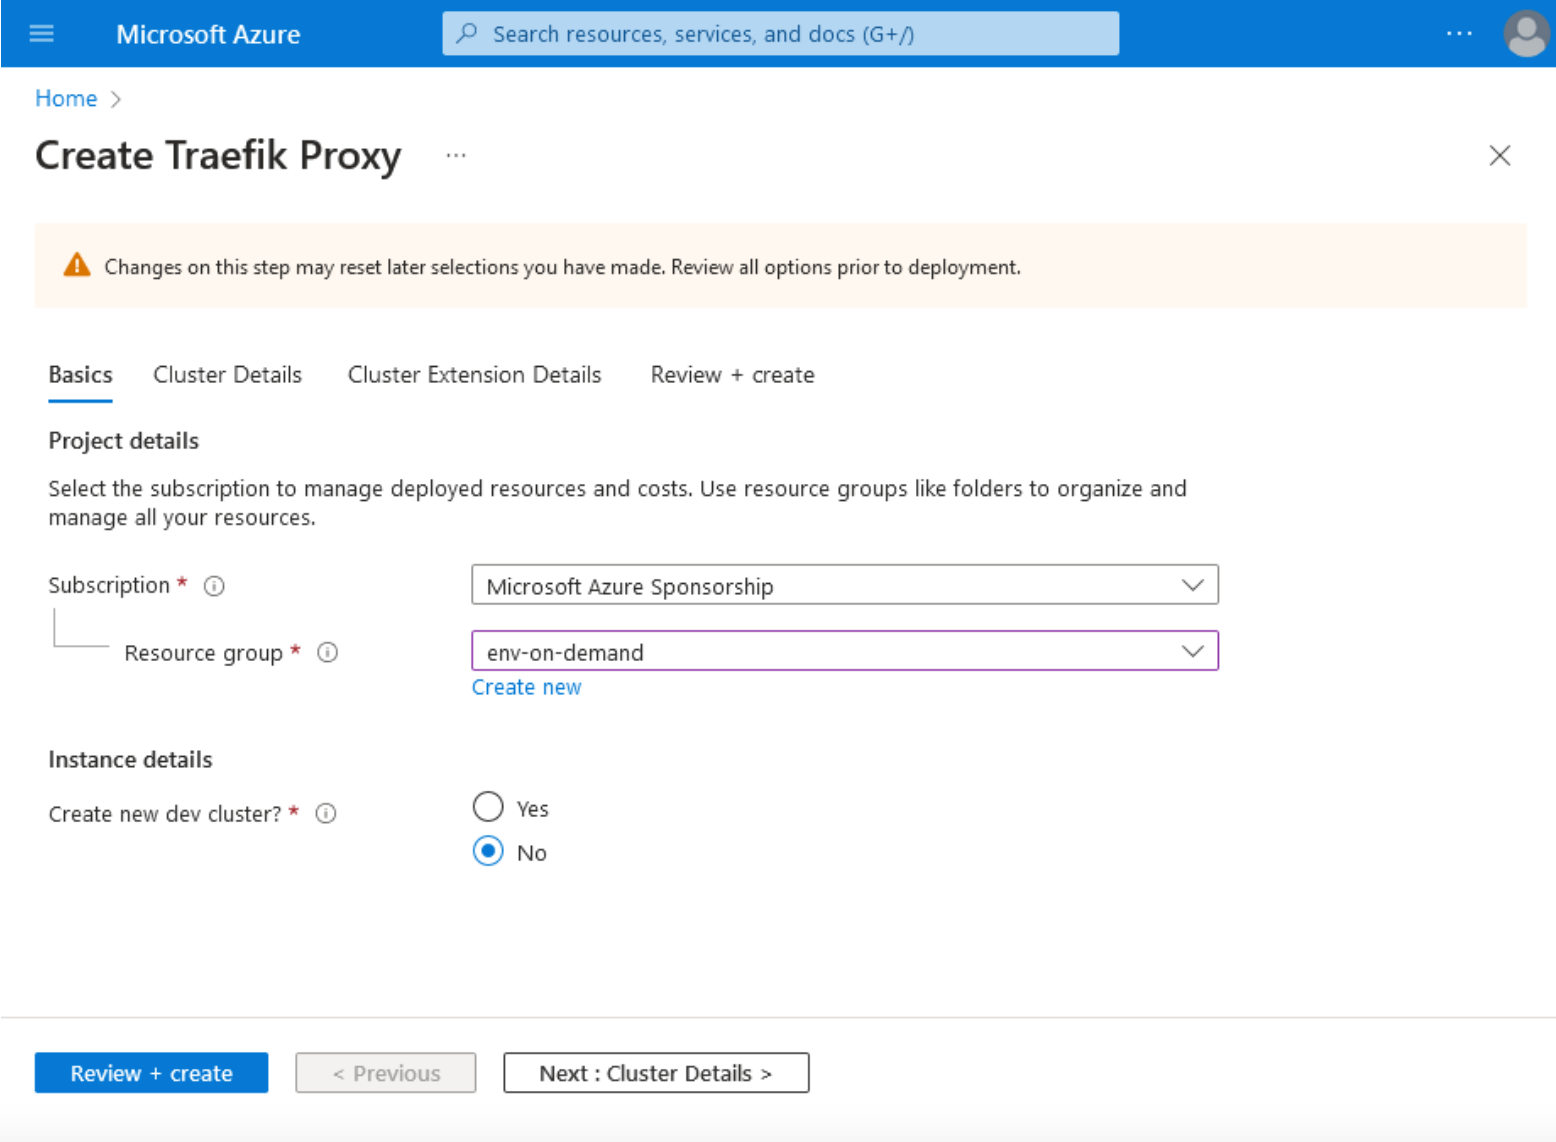
3. Next, click the Basics tab, and choose your Subscription, Resource group, and Instance details.
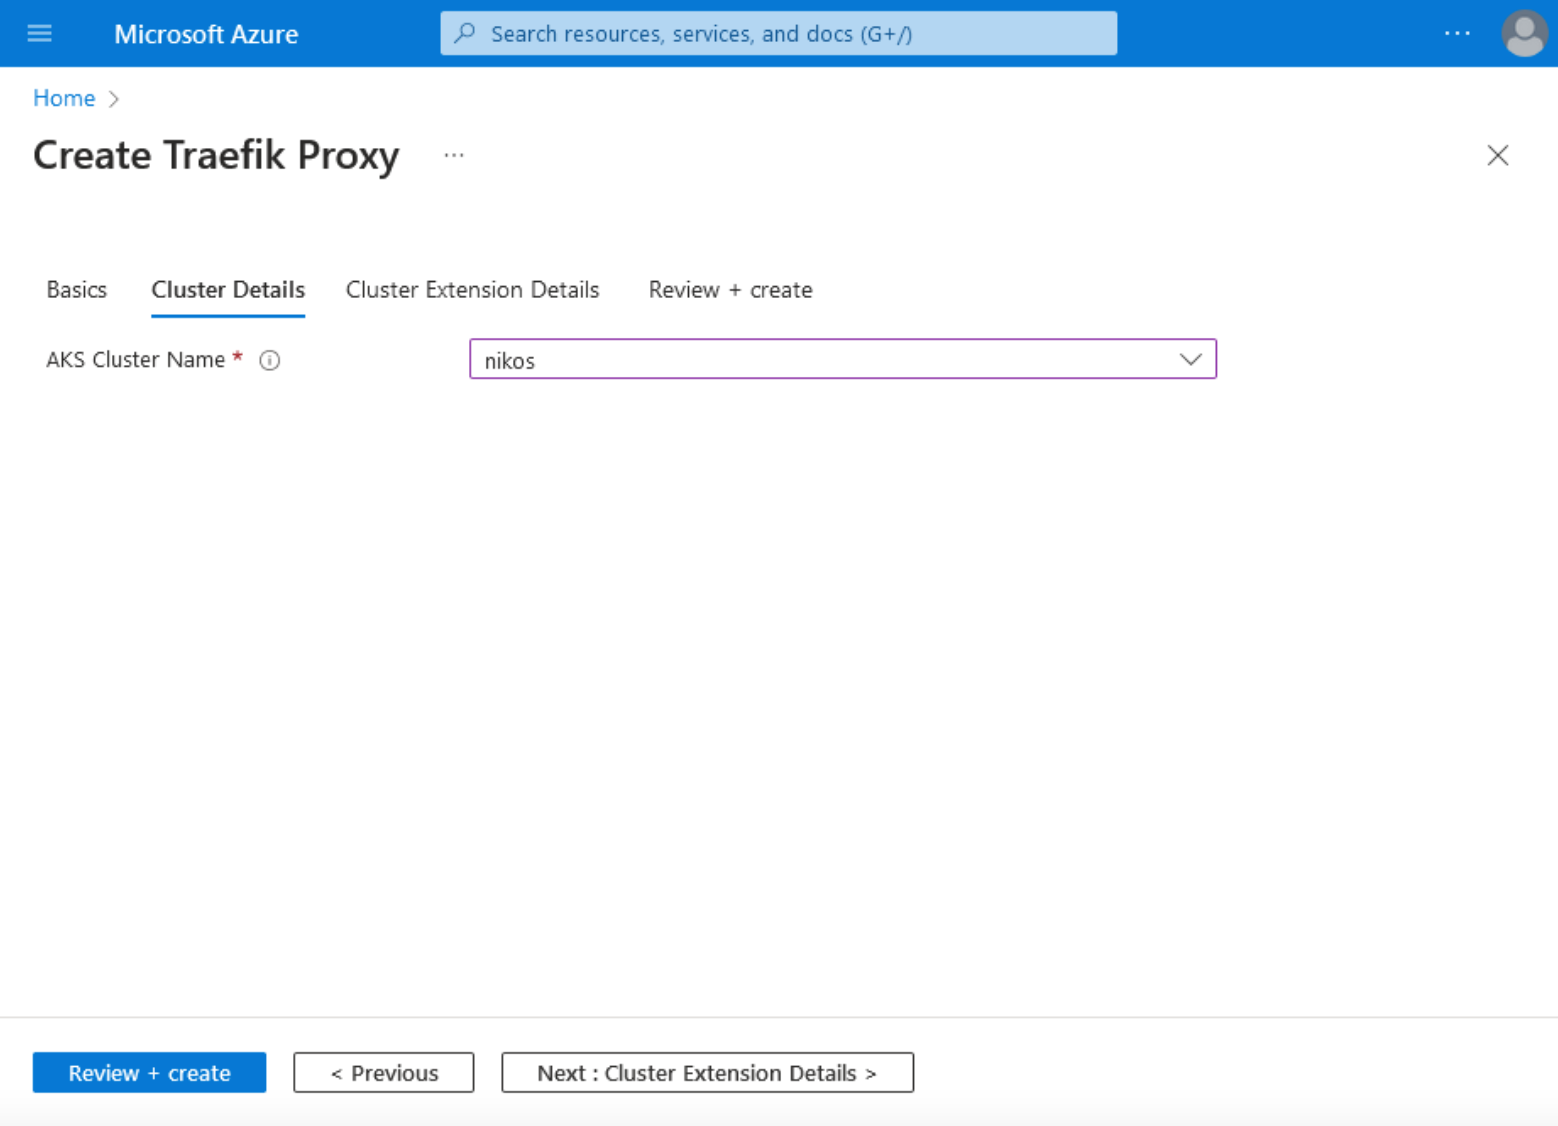
4. Click on Cluster Details, and choose your AKS Cluster Name.
5. In the Cluster Extension Details tab, fill in your Cluster extension resource name by filling in a numeric 6 to a 30-character-long alphanumeric value.
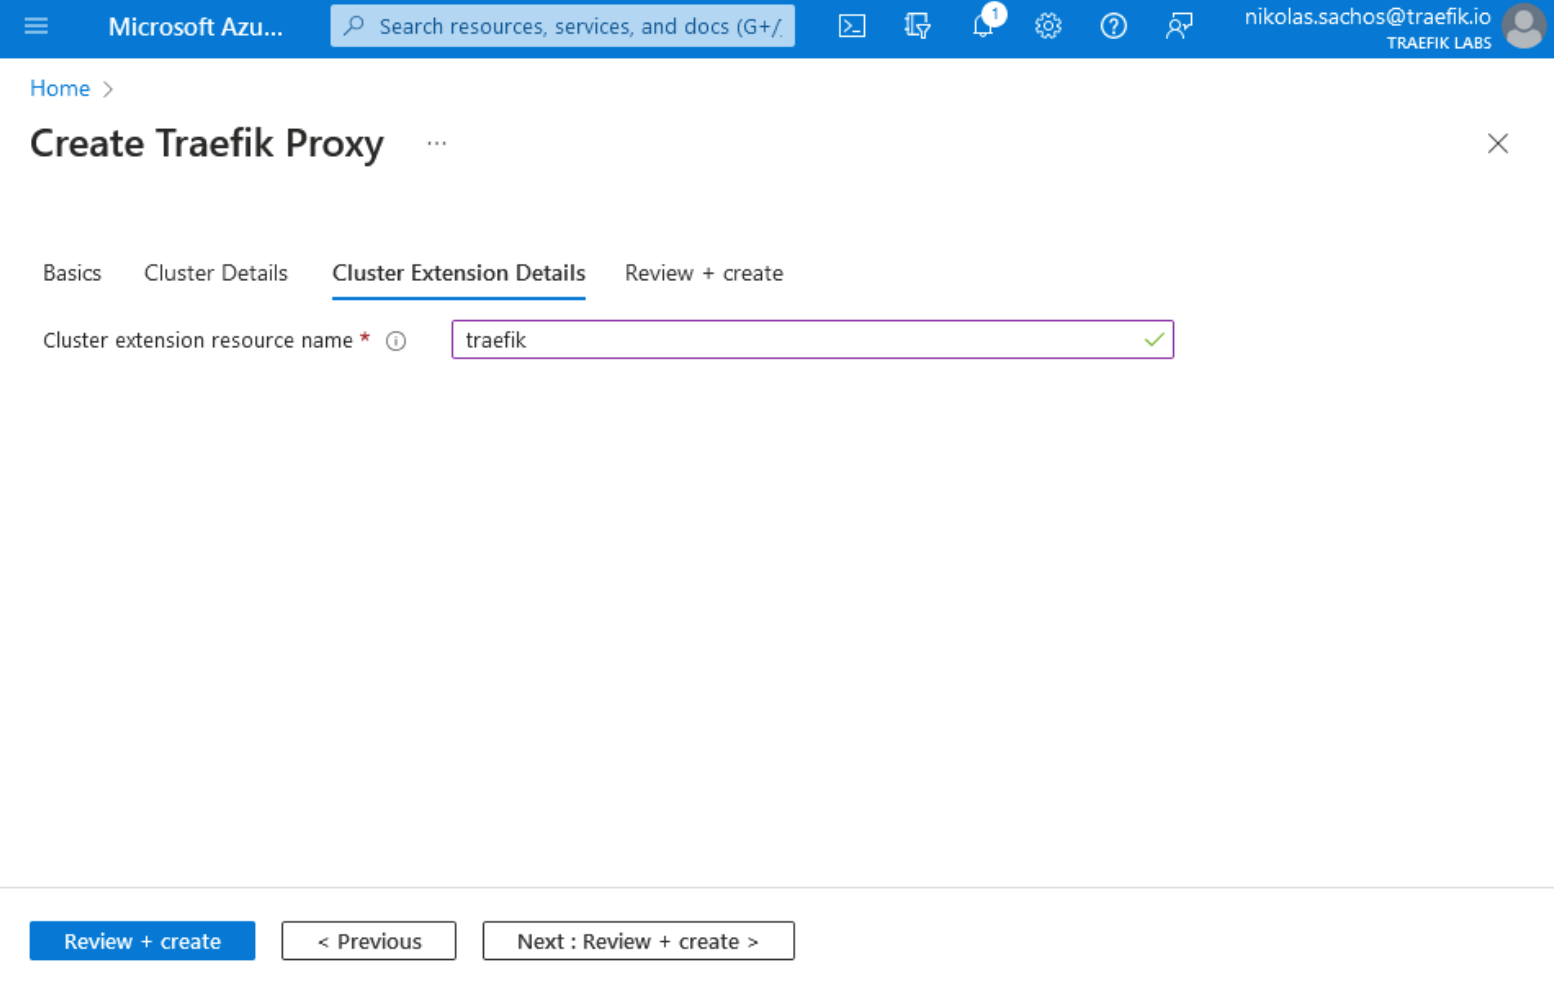
Note: In the Cluster Extension Details tab, fill in your Cluster extension resource name by filling in a numeric 6 to a 30-character-long alphanumeric value.
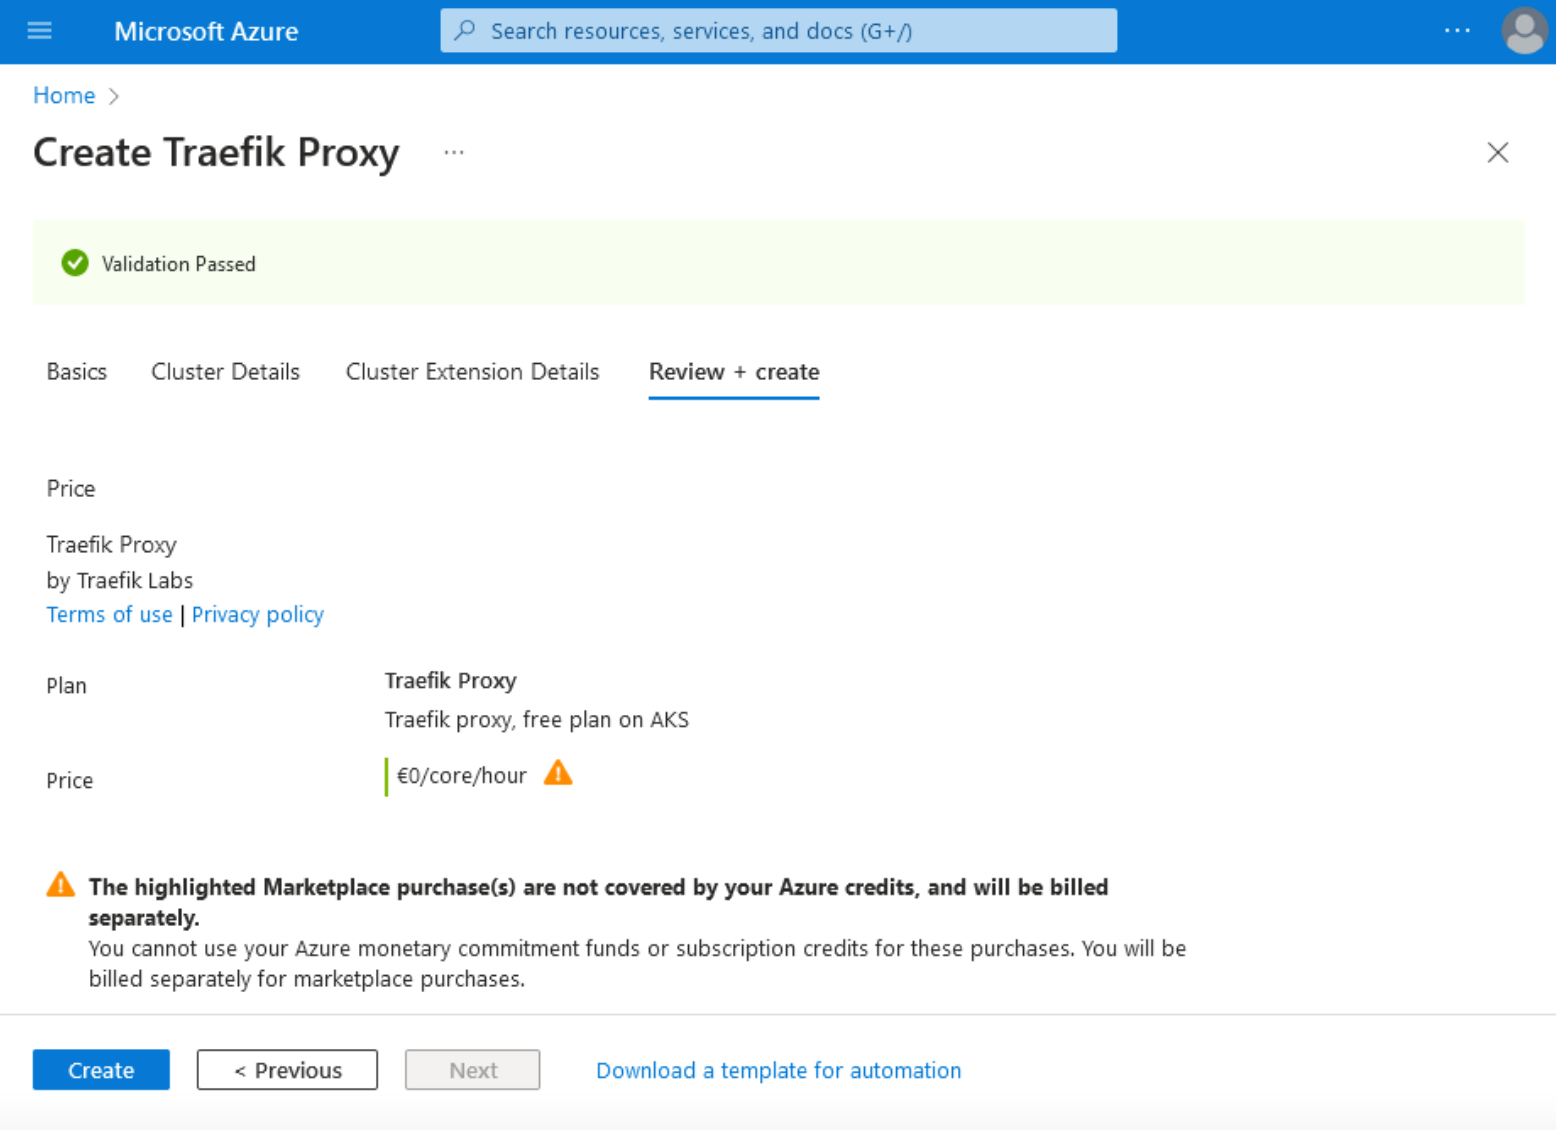
6. Finally, on the "Review + create tab", click the Create button at the bottom left of the page.
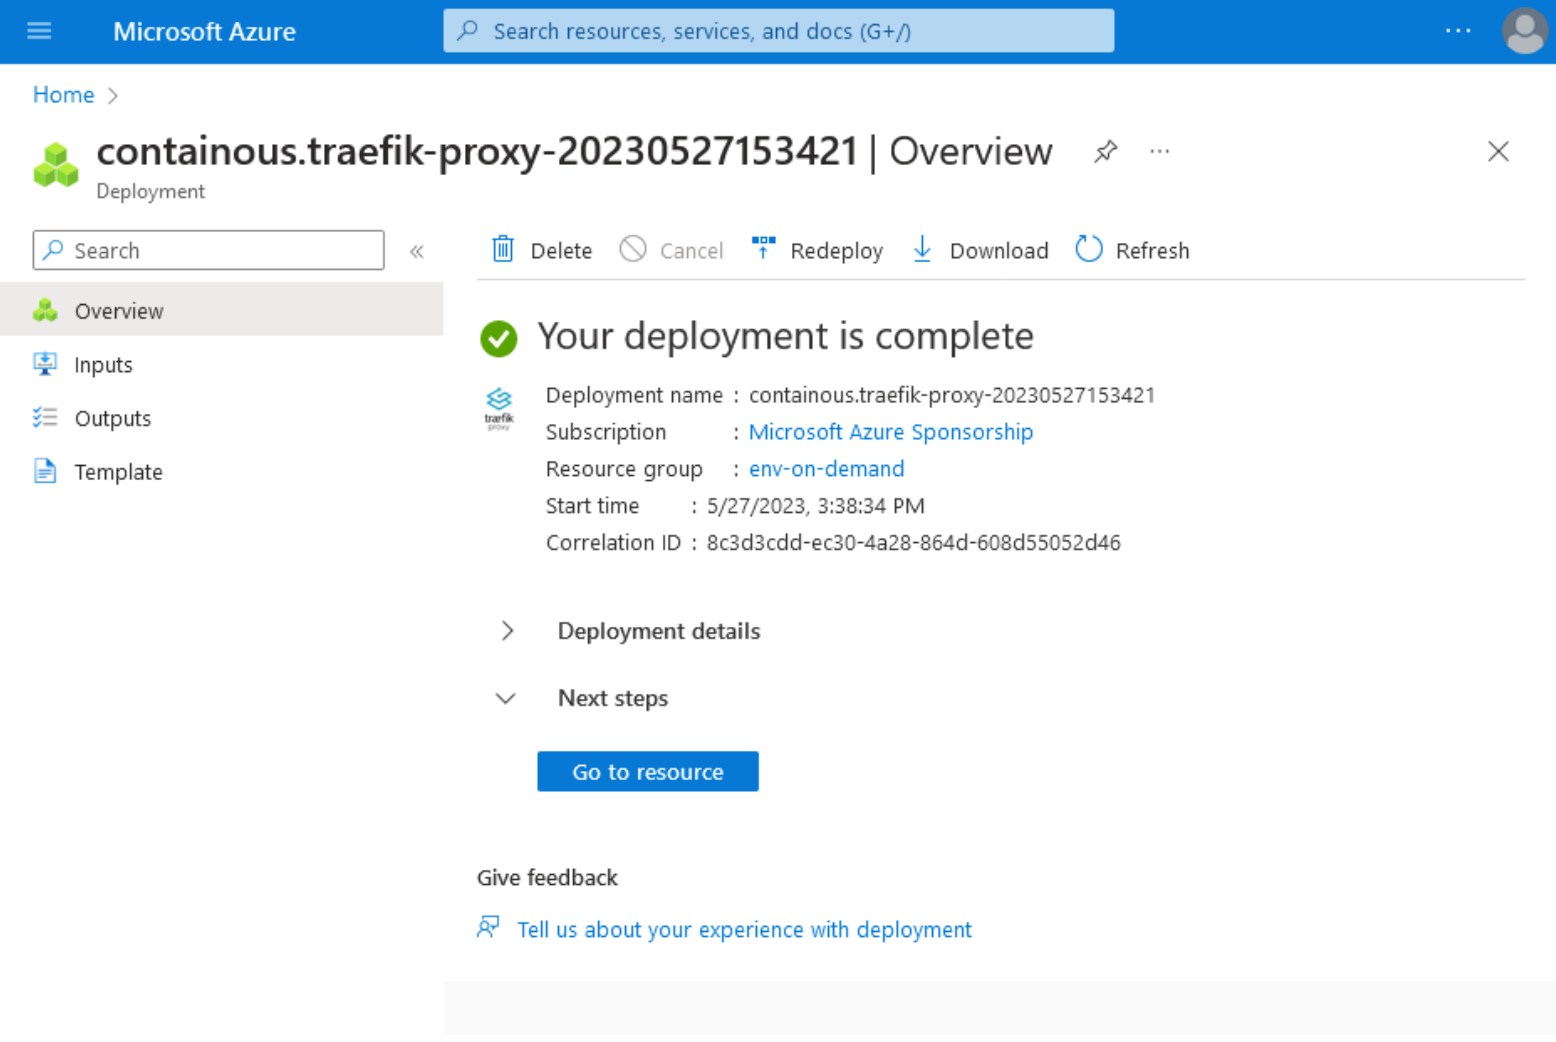
7. After completing the installation process, the following confirmation page will be displayed showing that the deployment is complete and one Traefik Proxy instance is running in your cluster.
To verify that the installation runs smoothly, we can list the pods in the Traefik namespace by running the command:
kubectl get pods -n traefik
The output verifying the Traefik pod is running as expected should be similar to:
NAME                        	            READY   STATUS	RESTARTS      AGE
traefik-5dbc588874-bfbpv    1/1 	   Running            0      	  5m
In order to get the Loadbalancer IP and verify that our services will be accessible from the outside world, we can list the Traefik services by executing the command:
kubectl get services -n traefik
Your output should show an External IP address similar to:
NAME        TYPE               CLUSTER-IP      EXTERNAL-IP    PORT(S)          AGE
traefik     LoadBalancer   10.0.93.113        20.4.131.79	80:32159/TCP,443:32202/TCP   5m
Your Traefik Proxy deployment is now active and operational. It's ready to accept connections on the Loadbalancer External-IP on ports 80 and 443.
8. Once your Traefik installation is running smoothly, the next step is to set up your routing rules and test them. This can be achieved by using the IngressRoute CRD to define your routes, services, and ports. The code below demonstrates how a Service and an IngressRoute can be applied to a cluster with a single command:
cat <<EOF | kubectl apply -f -
apiVersion: v1
kind: Namespace
metadata:
  name: apps
---
apiVersion: v1
kind: Service
metadata:
  name: my-service-name
  namespace: apps
spec:
  selector:
    app: my-app
  ports:
    - name: http
      protocol: TCP
      port: 3000
      targetPort: 3000
---
apiVersion: traefik.containo.us/v1alpha1
kind: IngressRoute
metadata:
  name: myIngressName
  namespace: apps
spec:
  entryPoints:
    - web
    - websecure
  routes:
    - kind: Rule
      match: Host(`example.com`)
      services:
        - name: my-service-name
          port: 3000
  tls:
certResolver: letsencrypt
Once you run the command above, the output will be
namespace/apps created
service/my-service-name created
ingressroute.traefik.containo.us/my-ingress created
and it will create a new namespace named apps, create a service in that namespace, and set up the routing rules for incoming traffic to this service.
9. Now you can configure access to the Traefik dashboard that will provide a visual insight into the health, performance, and routing configuration of your Traefik instance. To achieve this, we can use an IngressRoute CRD and define the appropriate metadata, entryPoints, and routes. Create a YAML file named dashboard-ingress.yaml, and paste the following content:
apiVersion: traefik.containo.us/v1alpha1
kind: IngressRoute
metadata:
  name: traefik-dashboard
  namespace: traefik
spec:
  entryPoints:
	- web
	- websecure
  routes:
  - kind: Rule
	match: Host(`example.com`) && (PathPrefix(`/api`) || PathPrefix(`/dashboard`))
	services:
	- name: api@internal
  	kind: TraefikService
  tls: {}
Do not forget to replace example.com with your preferred domain name.
Now to create the routing rules, apply the file by executing the command:
kubectl apply -f dashboard-ingress.yaml
To confirm that the dashboard has been deployed, your output should be:
ingressroute.traefik.containo.us/traefik-dashboard created
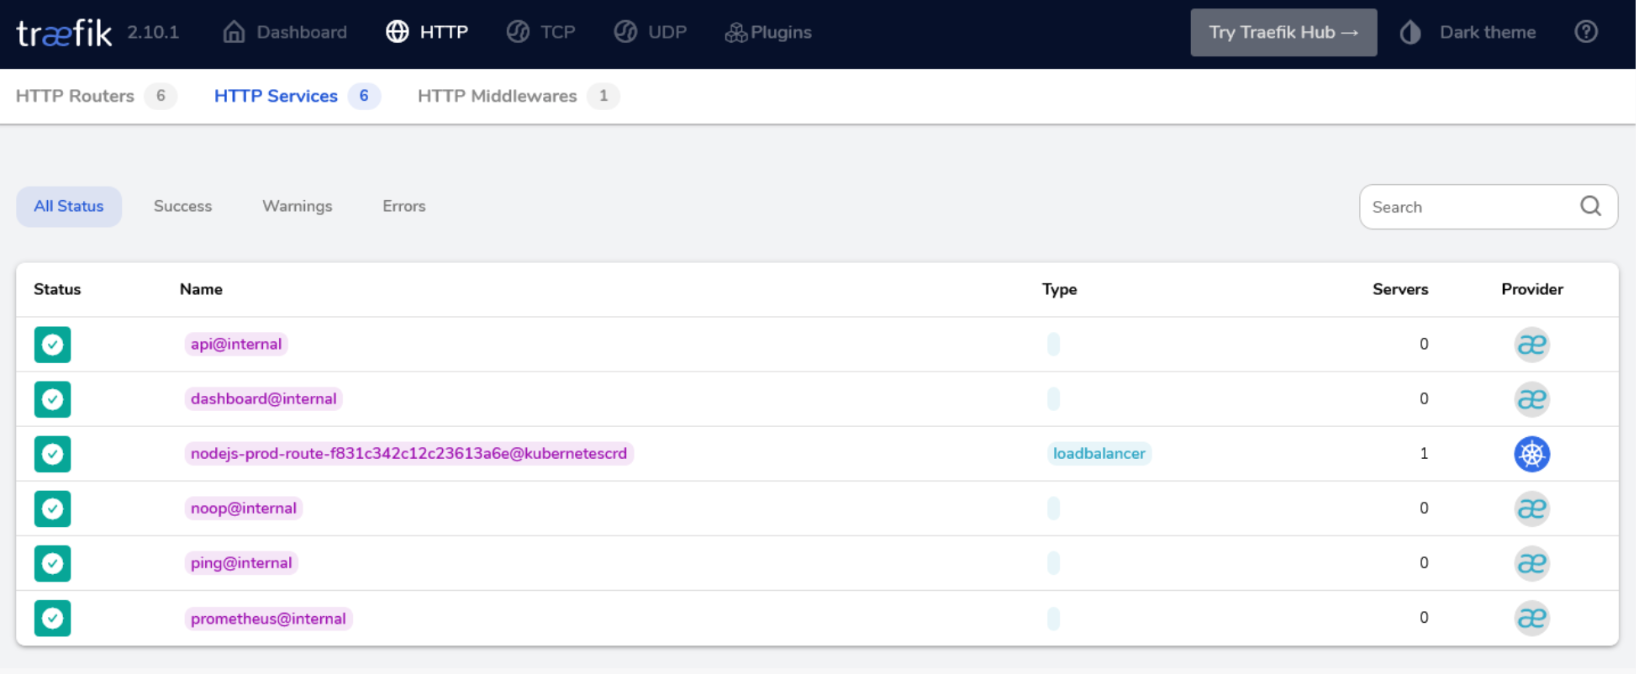
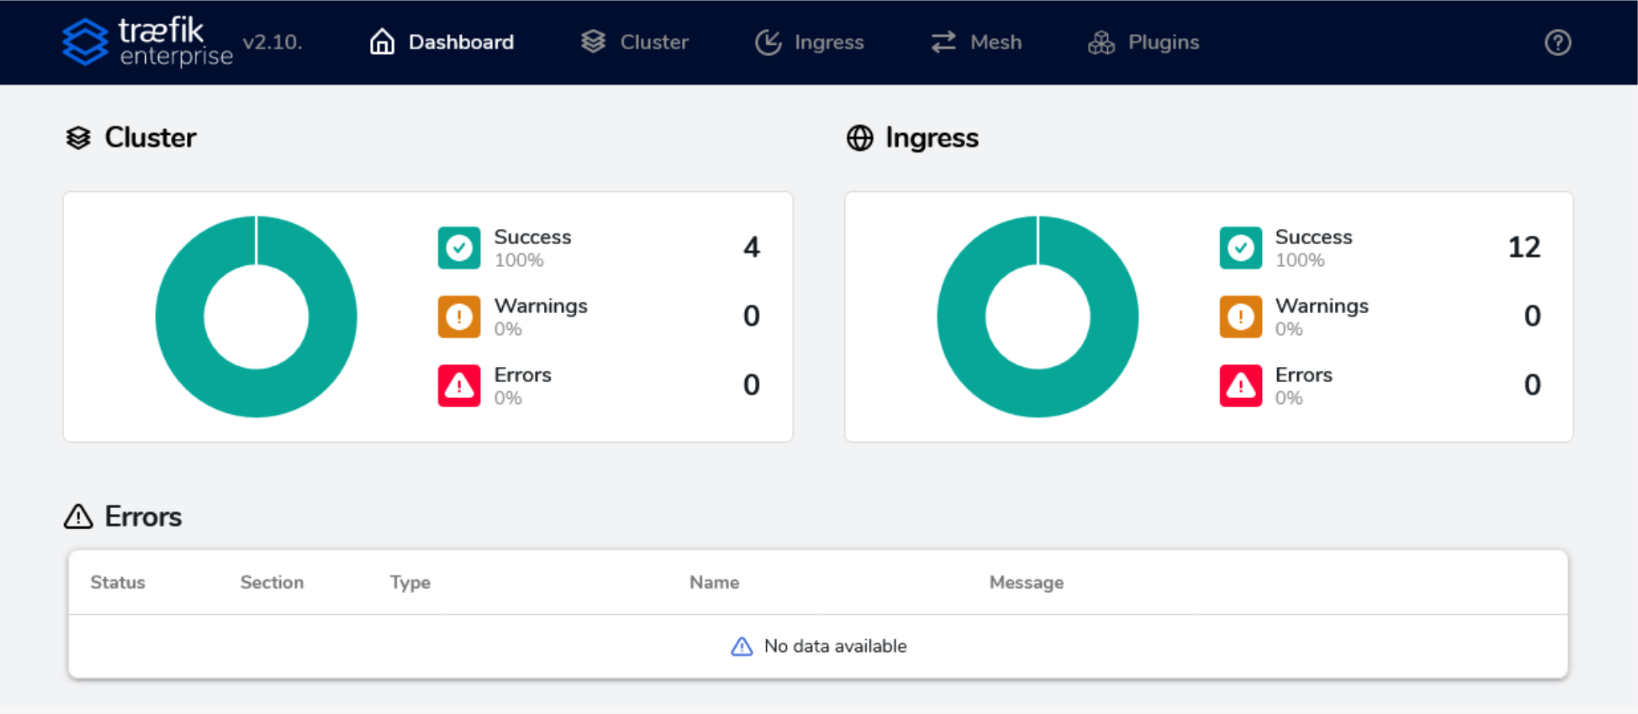
You can access the dashboard at https://example.com/dashboard/. Below is a screenshot highlighting the various HTTP, TCP, and UDP Routers, Services, and Middlewares running across a single cluster.
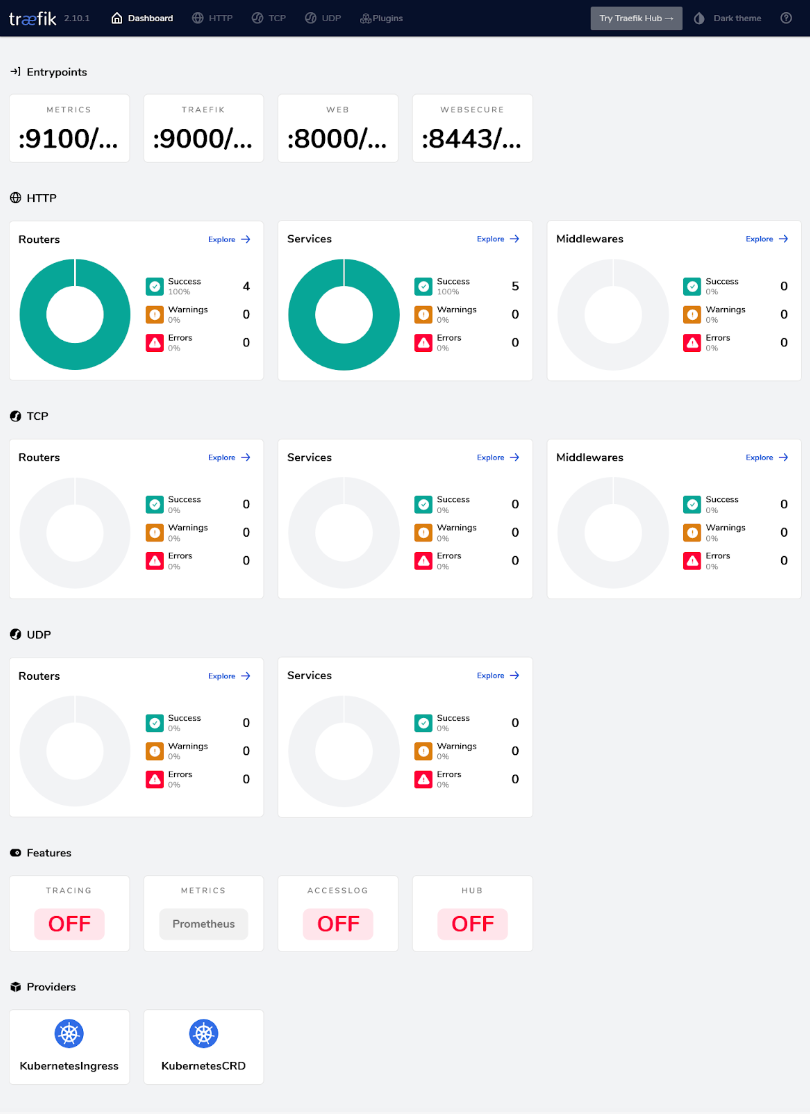
An interesting feature of the Dashboard is that when an error occurs in a Pod (referred to as Server within the interface), then automatically, a part of the graph will become red, notifying you about the issue while also giving you the exact error message.
10. With our Dashboard operational, let’s now use the Traefik automated service discovery. This is a built-in feature that dynamically discovers and configures routes to services as they are created (or destroyed) in your environment. We can deploy a simple Go-based webserver application and verify the service discovery by watching the changes live on the Dashboard.
Go ahead, and create a file my-app.yaml, and paste the code below:
apiVersion: v1
kind: Namespace
metadata:
  name: my-namespace
---
apiVersion: traefik.containo.us/v1alpha1
kind: Middleware
metadata:
  name: prod-rate-limit
  namespace: my-namespace
spec:
  rateLimit:
    average: 30
    burst: 50
---
apiVersion: v1
kind: Service
metadata:
  name: whoami
  namespace: my-namespace
spec:
  selector:
    app: whoami
  ports:
    - name: http
      protocol: TCP
      port: 80
      targetPort: 80
---
apiVersion: apps/v1
kind: Deployment
metadata:
  name: whoami
  namespace: my-namespace
spec:
  replicas: 1
  selector:
    matchLabels:
      app: whoami
  template:
    metadata:
      labels:
        app: whoami
    spec:
      containers:
      - name: whoami
        image: traefik/whoami
        ports:
        - containerPort: 80
---
apiVersion: traefik.containo.us/v1alpha1
kind: IngressRoute
metadata:
  name: prod-route
  namespace: my-namespace
spec:
  entryPoints:
    - web
    - websecure
  routes:
    - kind: Rule
      match: Host(`example.com`)
      services:
        - name: whoami
          port: 80
      middlewares:
        - name: prod-rate-limit
  tls: {}
And apply the manifest by executing the command:
kubectl apply -f my-app.yaml
Your output should look similar with:
namespace/my-namespace created
middleware.traefik.containo.us/prod-rate-limit created
service/whoami created
deployment.apps/whoami created
ingressroute.traefik.containo.us/prod-route created
The namespace, middleware, service, deployment, and ingress routes are now created, meaning your application is now deployed and ready to be used. After a few seconds, you will notice that your Dashboard interface displays two new Routers, one new Service, and one new Middleware in the HTTP section.
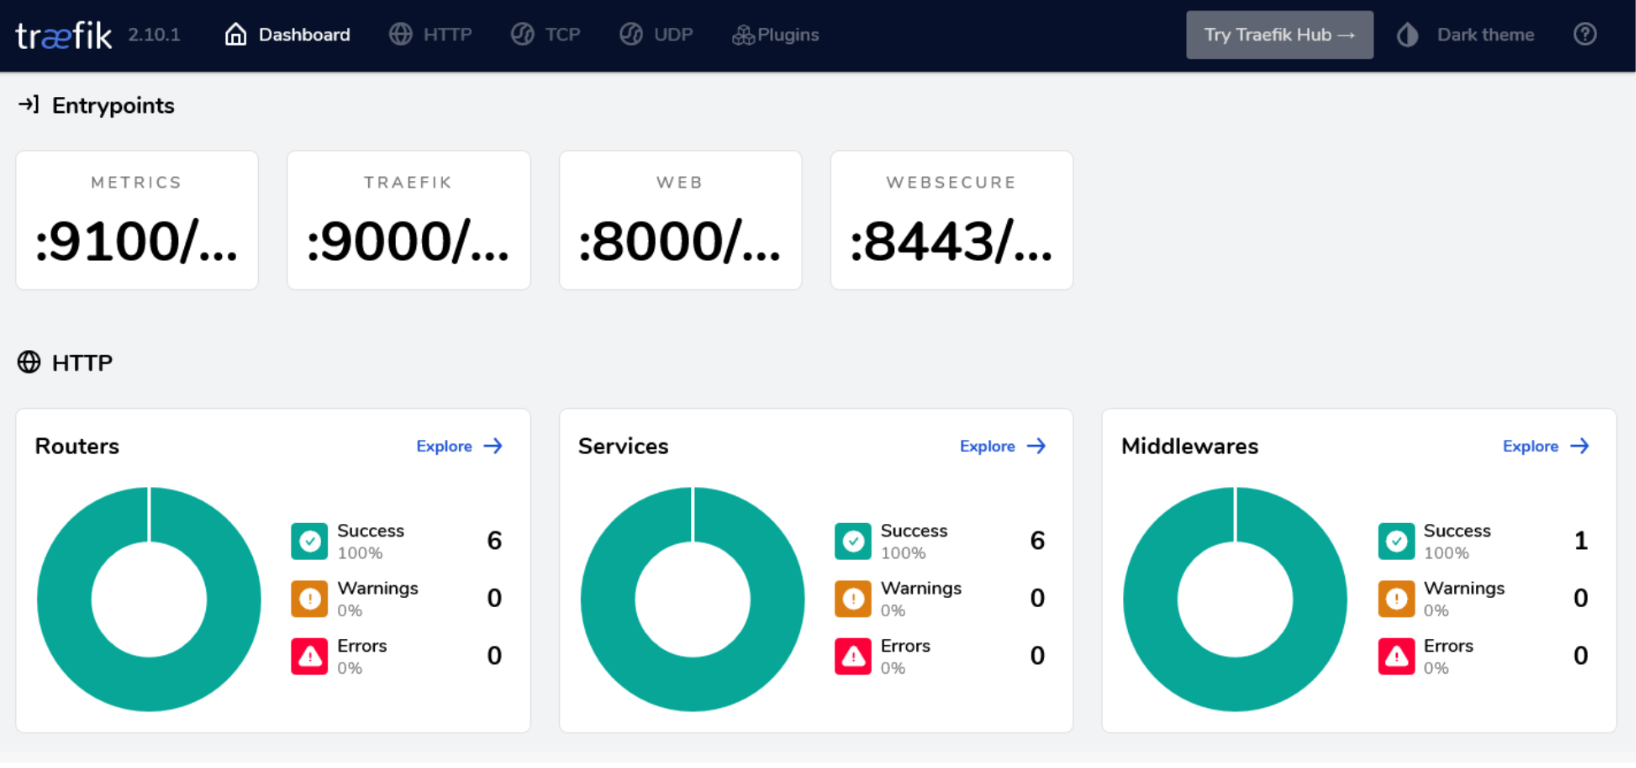
By clicking on the Explore link on the Services box, you will see the new Service name my-namespace-prod-route-(randomid)@kubernetescrd, with Type loadbalancer having one Server (the Nodejs pod) using the kubernetescrd Provider. The randomid is a random string that Traefik produces internally to avoid possible conflicts.
At this point, we have completed all necessary steps to enable our Traefik dashboard and deployed an example application to see its effects displayed live on the screen. This will conclude our installation guide, and from this point on, you may apply any other manifests like you normally would.
Now that we've covered the installation process for Traefik Proxy via Azure Marketplace let's explore why you might want to consider Traefik Enterprise for your AKS deployment. If you're running mission-critical applications in production, we strongly recommend considering Traefik Enterprise. Why? Traefik Enterprise offers a robust suite of features designed specifically to meet the demands of such important environments. It provides an array of advanced security measures, sophisticated traffic management capabilities, high availability, scalability, and comprehensive monitoring and troubleshooting tools.
Why Choose Traefik Enterprise for Your AKS Deployment?
Traefik Enterprise is a robust and versatile API Gateway and Ingress solution designed to cater to the needs of enterprises. Its numerous features and benefits make it an ideal choice for Azure Kubernetes Service (AKS) deployments:
- Security: Traefik Enterprise offers security features such as IP Allow List, Access Control protocols support, and Distributed Let’s Encrypt. It separates responsibilities between two planes for enhanced security.
- Traffic Management: Traefik Enterprise provides dynamic configuration, service discovery, traffic mirroring, deployment strategies, health checks, rate limiting, and service mesh capabilities for advanced traffic management.
- High Availability: Traefik Enterprise ensures continuous service availability with its fault-tolerant design. It runs natively in cluster mode, storing all cluster data, and works with AKS for seamless application scaling.
- Scalability: Traefik Enterprise scales with your applications and supports various deployment methods for easy replication across different environments.
- Monitoring and Troubleshooting: It offers a dashboard, proxy health checks, and support for tracing and real-time monitoring tools. Integrated with AKS, it helps understand traffic flow and service dependencies for efficient troubleshooting
Step-by-Step Instructions for Installing Traefik Enterprise via Azure Marketplace
To get started with the installation of Traefik Enterprise in AKS, make sure you first request a Traefik Enterprise trial.
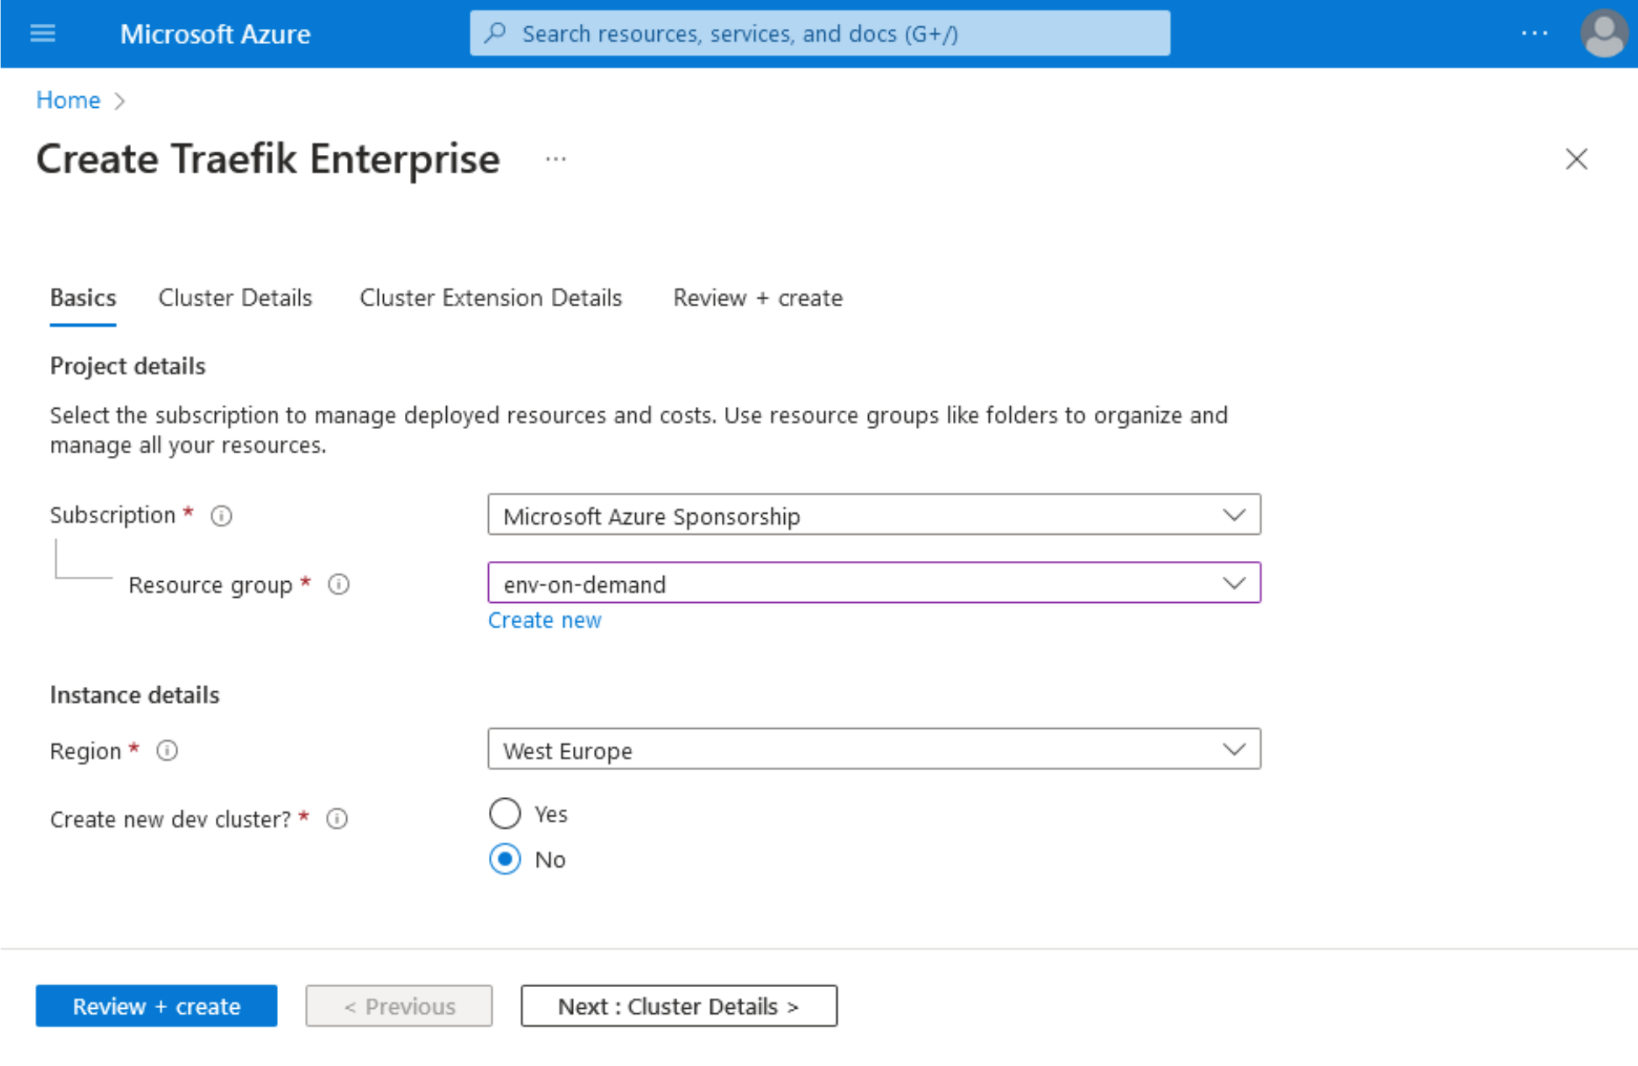
1. Visit Microsoft Azure Portal and type Traefik Enterprise in the top search bar. Then, click on the correspondent link under the Marketplace section.
2. Click on the Basic tab, then choose your Subscription, Resource group, and Instance details.
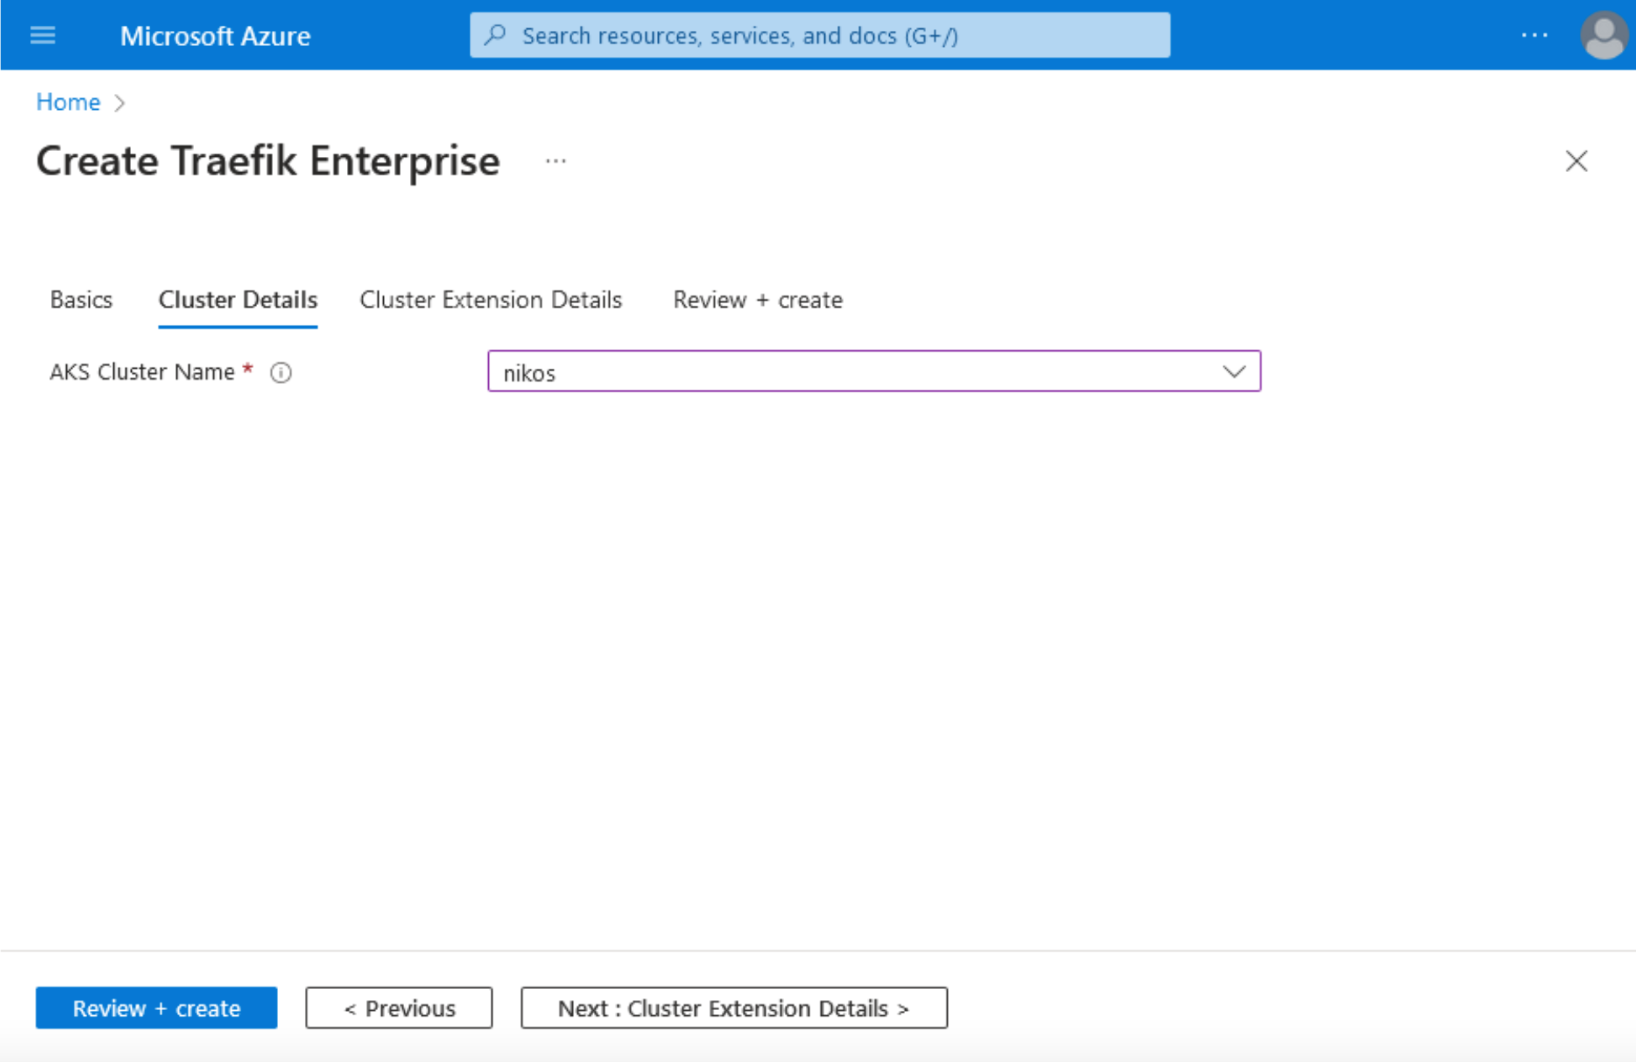
3. In the Cluster details tab, choose your AKS Cluster name.
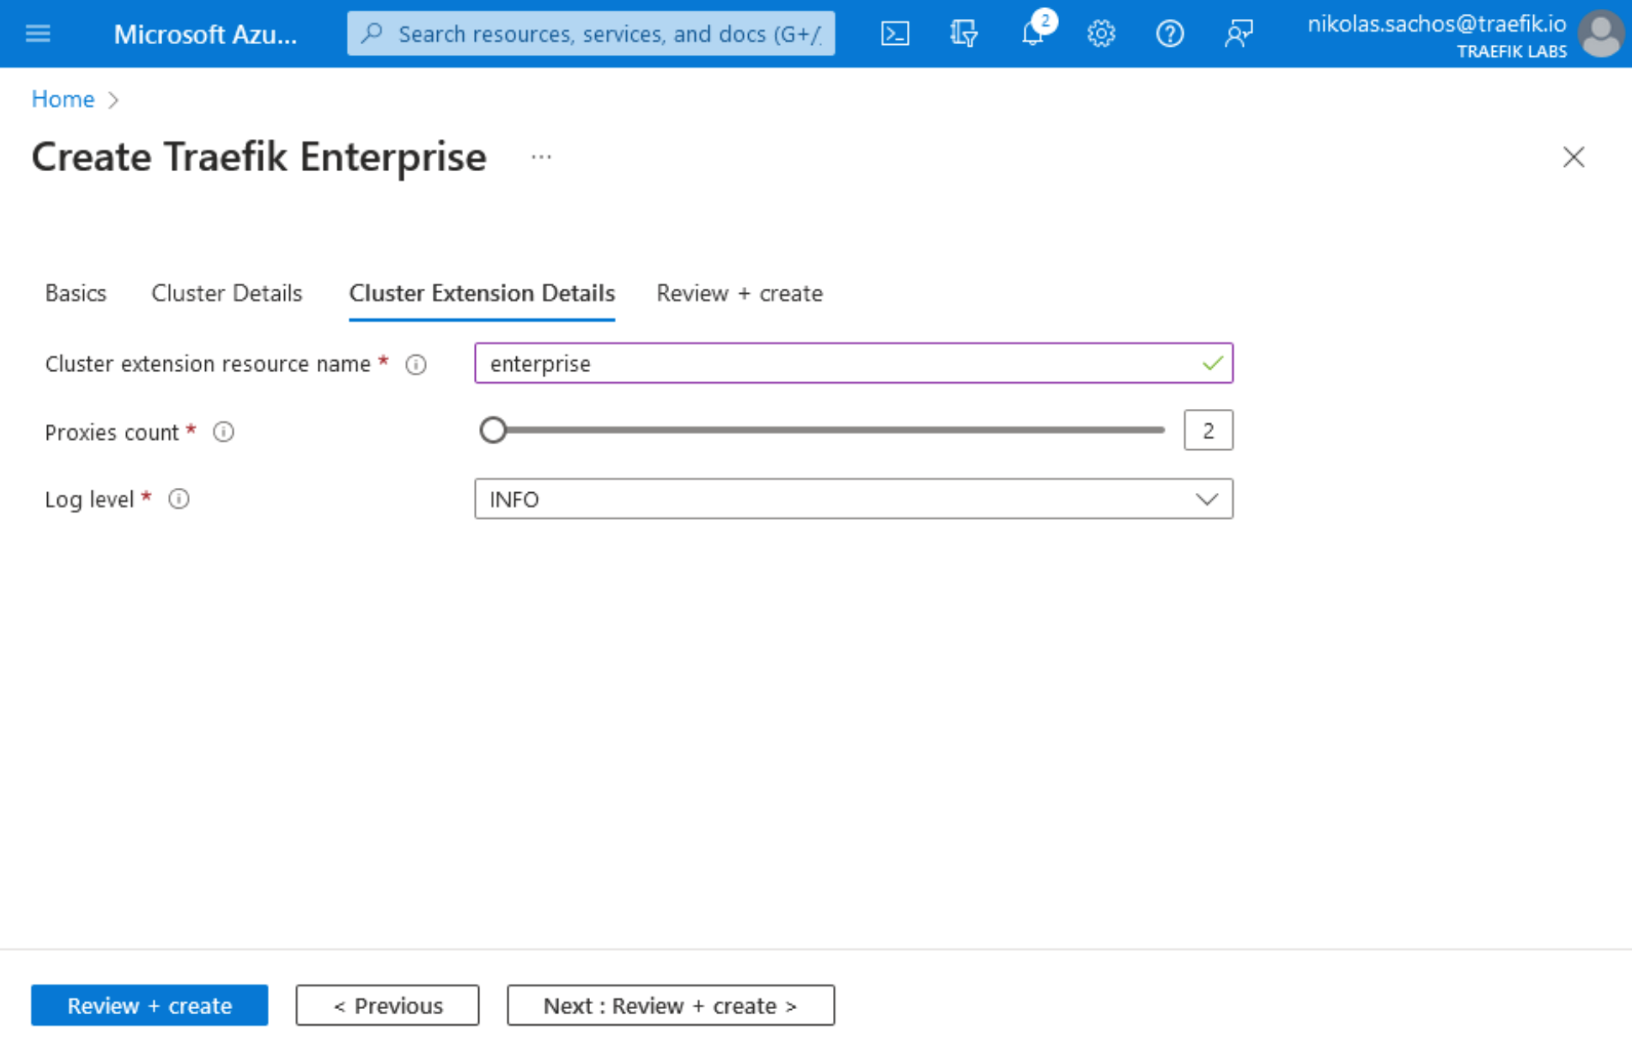
4. Next, in Cluster Extension details, choose your Cluster Extension Resource name, and the number of Proxy instances.
5. By clicking on the Review + Create tab, you will see the summary of your Traefik Enterprise installation on AKS. Next, click the Create button.
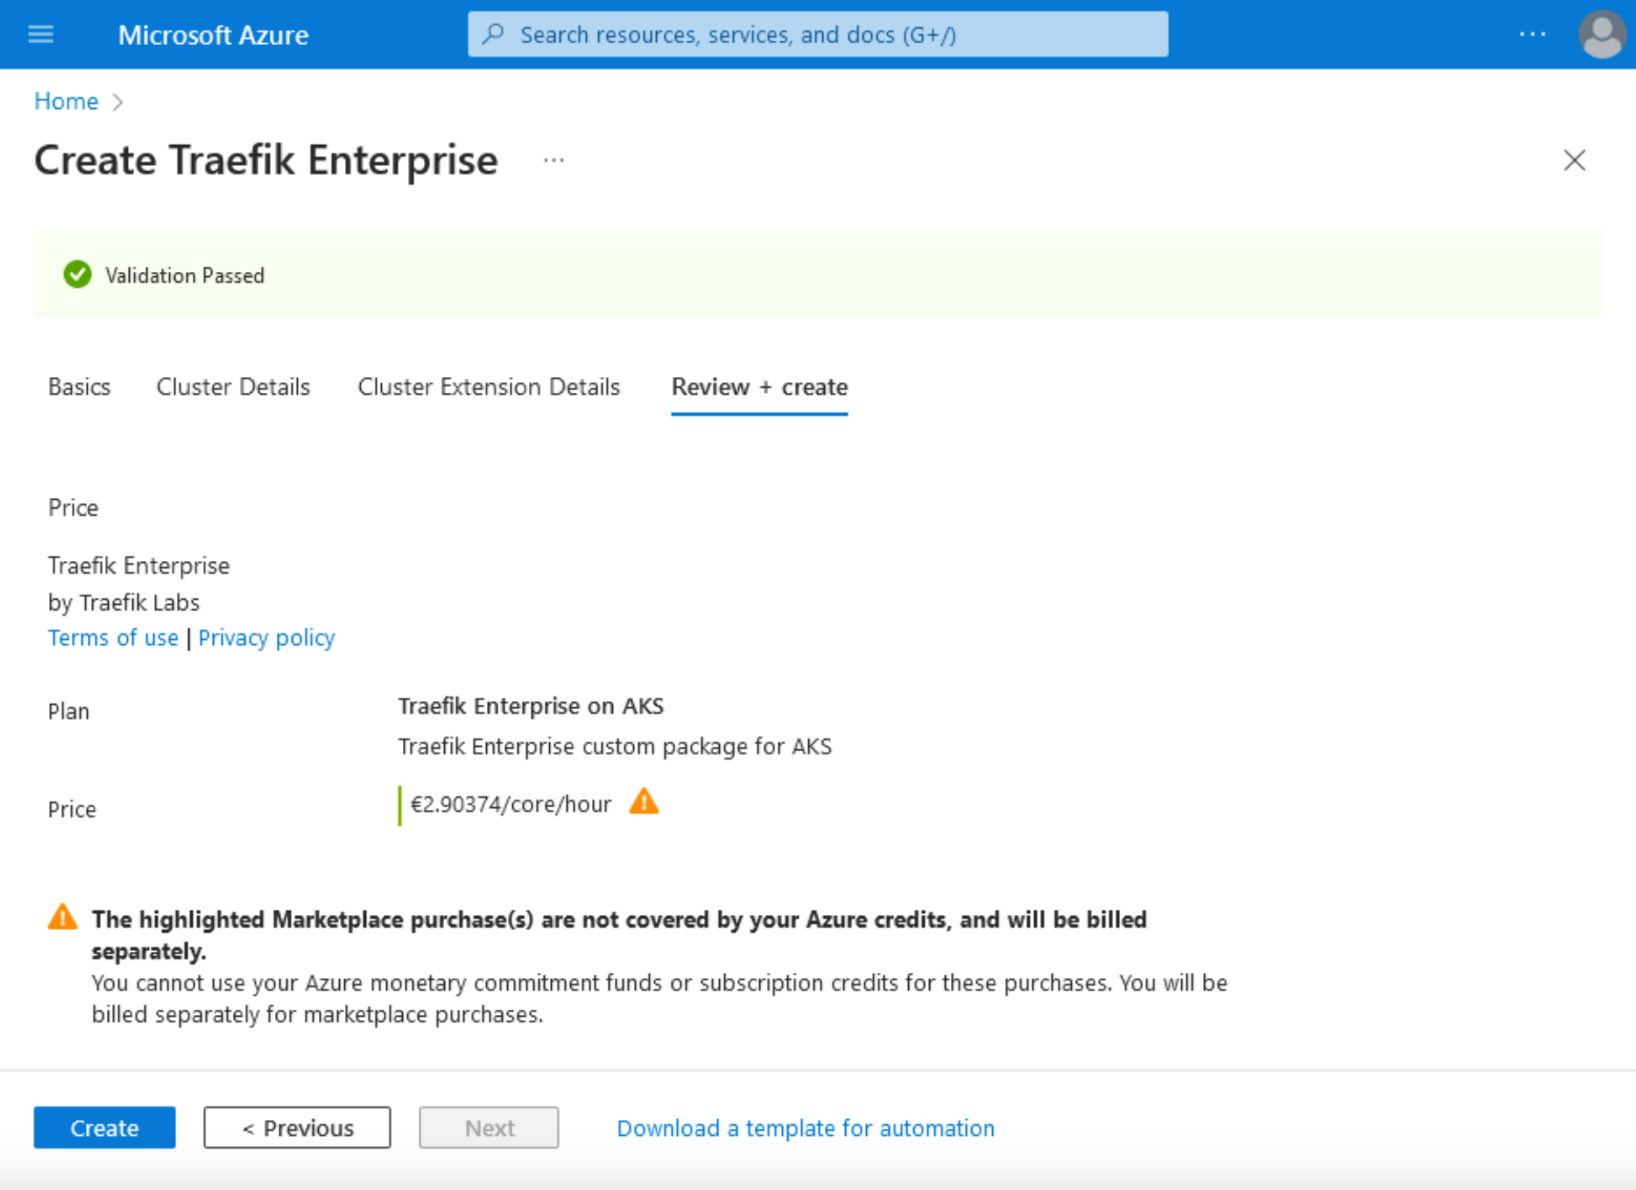
6. After completing the installation process, the following confirmation page will be displayed showing that the deployment is complete and one Traefik Enterprise instance is running in your cluster.

Now you can list Traefik Enterprise pods in traefikee namespace to verify that they are running, by executing the command:
kubectl get pods -n traefikee
Your output should list all running pods in traefikee namespace:
NAME                         	          READY   STATUS    RESTARTS    AGE
default-controller-0        	            1/1 	 Running            0	       10m
default-plugin-registry-0   	            1/1 	 Running   	   0      	       10m
default-proxy-d4c5549fc-7sl4f       1/1  	 Running   	   0      	       10m
default-proxy-d4c5549fc-ftgnj        1/1 	 Running   	   0      	       10m
Traefik’s services can be listed by executing the command:
kubectl get services -n traefikee
Your output should be very identical with the one below:
NAME                                         TYPE        CLUSTER-IP   EXTERNAL-IP  PORT(S) AGE
default-ctrl-svc                       ClusterIP        None             <none>     	<none>   20m
default-plugin-registry-svc   ClusterIP  	 10.0.52.229  <none>          443/TCP 20m
default-proxy-svc         	LoadBalancer 10.0.15.250  20.4.133.168 80:30876/TCP,443:31247/TCP   20m
The service default-proxy-svc was assigned an external IP by the provisioned Azure load balancer, and now can accept traffic in ports 80 and 443.
7. Traefik Enterprise is now running, and the next step is to configure it. The configuration can be done using teectl, a comprehensive command-line tool designed to interact with Traefik Enterprise. Follow the installation instructions in order to generate the controller configuration. This configuration is essential for Traefik Enterprise to handle incoming traffic, enable the Dashboard, and define certificate resolvers. The series of commands described below can be used to generate the necessary credentials to interact with your Kubernetes cluster using Traefik's teectl tool, and to configure teectl to use those credentials.
Continue by executing the following commands:
kubectl exec -n traefikee default-controller-0 -- /traefikee generate credentials --kubernetes.kubeconfig=/home/username/.kube/config --cluster=default > tee_config.yaml
teectl cluster import --file=tee_config.yaml
teectl cluster use --name=default
Remember to replace username with your actual user.
The output of the commands above will display your default pod that teectl interacts with, the cluster name, and the context namebe:
Defaulted container "default-controller" out of: default-controller, wait-dns (init)
Cluster "default" imported
Cluster context has been set to "default"
8. Now you must generate the static configuration. This is crucial because it sets up the foundational settings for your Traefik instance. The configuration will include the Providers, entryPoints, Dashboard enablement, and certificatesResolvers and is essential because it provides the foundational settings for your Traefik instance. The static configuration contains settings that define how Traefik will run and interact with your environment, and once set; these settings are not dynamically reloadable.
Create a file named static.yaml, and paste the following content:
providers:
  kubernetesCRD: {}

entryPoints:
  web:
    address: ":80"
  websecure:
    address: ":443"
  internal:
    address: ":8888"

api:
  dashboard: true

certificatesResolvers:
  letsencrypt:
    acme:
      email: your_email_address
      tlsChallenge: {}
Replace your_email_address with your email address.
- Now apply the static configuration by running:
teectl apply –file=./static.yaml
The command above does not produce an output, and at this step, you should have Traefik Enterprise correctly configured. The next step will involve creating the Ingress route for the Dashboard.
Create a file called dashboard-ingress.yaml, and the content:
apiVersion: traefik.containo.us/v1alpha1
kind: IngressRoute
metadata:
  name: traefik-dashboard
  namespace: traefikee
spec:
  entryPoints:
	- websecure
  routes:
  - kind: Rule
	match: Host(`example.com`) && (PathPrefix(`/api`) || PathPrefix(`/dashboard`))
	services:
	- name: api@internal
  	kind: TraefikService
  tls:
	certResolver: letsencrypt
Replace example.com with your domain name.
10. Create your routing rules by applying the file dashboard-ingress.yaml.
kubectl apply -f dashboard-ingress.yaml
The output below displays the created ingressroute resource:
ingressroute.traefik.containo.us/traefik-dashboard created
This means that your routing rules to the api@internal service are now applied.
Visit the URL https://example.com/dashboard/. You will be able to access the dashboard.
Your Traefik’s Enterprise dashboard is now fully functioning!
- At this point, you can begin deploying your applications as you normally would. For instance, you can apply the following manifest that will create a namespace, service, deployment, and an IngressRoute, as seen below:
apiVersion: v1
kind: Namespace
metadata:
  name: my-namespace
---
apiVersion: traefik.containo.us/v1alpha1
kind: Middleware
metadata:
  name: prod-rate-limit
  namespace: my-namespace
spec:
  rateLimit:
    average: 30
    burst: 50
---
apiVersion: v1
kind: Service
metadata:
  name: whoami
  namespace: my-namespace
spec:
  selector:
    app: whoami
  ports:
    - name: http
      protocol: TCP
      port: 80
      targetPort: 80
---
apiVersion: apps/v1
kind: Deployment
metadata:
  name: whoami
  namespace: my-namespace
spec:
  replicas: 1
  selector:
    matchLabels:
      app: whoami
  template:
    metadata:
      labels:
        app: whoami
    spec:
      containers:
      - name: whoami
        image: traefik/whoami
        ports:
        - containerPort: 80
---
apiVersion: traefik.containo.us/v1alpha1
kind: IngressRoute
metadata:
  name: prod-route
  namespace: my-namespace
spec:
  entryPoints:
    - web
    - websecure
  routes:
    - kind: Rule
      match: Host(`example.com`)
      services:
        - name: whoami
          port: 80
      middlewares:
        - name: prod-rate-limit
  tls:
    certResolver: letsencrypt
Replace example.com with the domain name of your choice. In the example code above, we used the image traefik/whoami, which is a tiny Go webserver that prints OS information and HTTP requests to output. So When you visit https://your-domain.com, you will see such information displayed on your screen.
This last step has our deployment guide completed.
Enhancing Your Setup for API Management on Top of Traefik Proxy or Traefik Enterprise
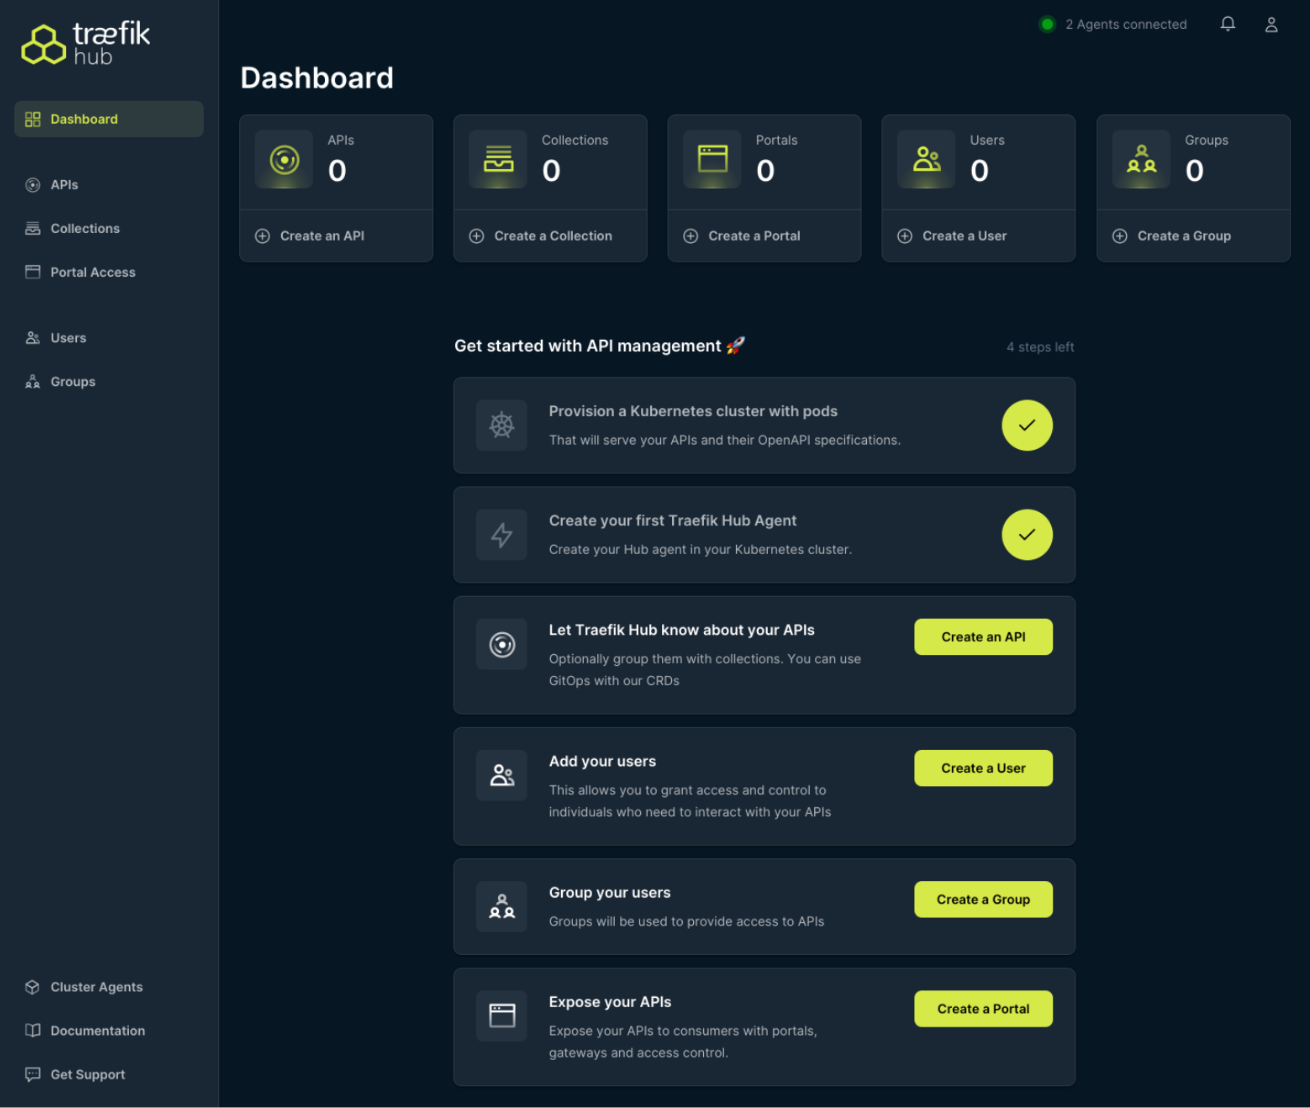
Once you have deployed Traefik Proxy or Traefik Enterprise on AKS, you might consider enhancing your setup with Traefik Hub. Traefik Hub is a Kubernetes-native API management platform that integrates seamlessly with Traefik Proxy and Traefik Enterprise, offering a streamlined solution for publishing, securing, and managing APIs.To get started with Traefik Hub, you can request a free trial here. You'll be able to deploy the Traefik Hub Agent in your Kubernetes cluster, following the guidelines provided in the official documentation. Traefik Hub offers a dashboard and onboarding steps making it easy to get started as demonstrated below.
Wrapping it Up
Traefik Proxy, Traefik Enterprise, and Traefik Hub provide enhanced connectivity and API management for AKS environments. Offering advanced security, traffic management, scalability, and monitoring, they help developers and enterprises streamline their application publishing and security. By following our installation guides and Traefik Hub introduction, you can easily tap into these additional features to optimize your AKS setup.
Interested in getting started with Traefik in AKS? Schedule a personalized demo of Traefik Enterprise with us. We'll guide you through its main features and demonstrate how it can fit into your specific AKS use case.