Enhancing API Observability: Traefik Hub, OpenTelemetry, and the New Era of Data-Driven API Management


In today's interconnected digital landscape, application programming interfaces (APIs) serve as the invisible architects, shaping the way we interact with technology. They are the unsung heroes behind the scenes, propelling innovation, driving new business models, and seamlessly delivering products and services across diverse channels. As the backbone of the digital era, APIs command a staggering 54% of total requests and are growing twice as fast as web traffic, underscoring their pivotal role in the evolution of technology.
The API market, once valued at $5 billion in 2022, is forecasted to skyrocket to $40 billion by 2030. This meteoric rise is fueled by the fact that two-thirds of companies are either embracing or fully adopting API-first strategies. As the world becomes increasingly connected, APIs are not just a technological necessity but a strategic imperative for businesses looking to thrive in the digital age.
However, with great impact comes the need for visibility and control. Observability has become paramount in the era of modern and distributed systems, as well as for the APIs connecting them. This paradigm shift from monitoring with simple metrics to comprehensive telemetry analysis is vital for today’s issue resolution, performance optimization, and user satisfaction.
Enter OpenTelemetry, a game-changer in the realm of observability.
OpenTelemetry: The Observability Enabler
Designed to streamline telemetry data collection from distributed systems, OpenTelemetry replaces multiple vendor-specific agents, simplifying and unifying dynamic systems telemetry data. It provides a unified standard, ensures consistent instrumentation across various programming languages, and offers enhanced insights into application use, health, and performance. This becomes especially important as organizations deal with the complexities of microservices and cloud-native architectures.
In this blog post, we will delve into the critical role of OpenTelemetry in achieving comprehensive observability and explore how it addresses the challenges posed by modern software architectures and APIs. For context, API gateways play a pivotal role in managing and securing API traffic, together with the need for visibility into APIs’ health, usage, and performance. Whether with issue alerts, event correlation for rapid issue fault-domain isolation, or cross-domains causations and root-cause analysis, OpenTelemetry emerges as a key enabler in ensuring the reliability and performance of API-driven systems.

Understanding OpenTelemetry
OpenTelemetry is an open-source project that emerged in 2019 combining the OpenTracing and OpenCensus projects. It quickly became a game-changer unifying and streamlining the collection of telemetry data from distributed systems across tech stacks. Born out of the necessity for a unified approach governed to date by multiple proprietary approaches, OpenTelemetry provides a standardized, open telemetry framework for comprehensive visibility into health, usage, and performance across infrastructure, services, and applications.
Metric types in OpenTelemetry serve as the bedrock for understanding system performance and behavior:
- Counter: Tracks continuously increasing numeric values, ideal for counting occurrences of events.
- UpDownCounter: A versatile counter that accommodates both positive and negative changes, offering flexibility in tracking fluctuations.
- Gauge: Offers a snapshot of a value at a specific moment, providing insight into the current state of a system.
- Histogram: Captures the distribution of observed values over time, offering a nuanced view of data spread and central tendency.
On the other hand, metric labels play a pivotal role in enhancing the granularity and context of metrics. Labels are key-value pairs associated with metric data, allowing for more nuanced and specific insights into system behavior.
Let's consider a practical example in the context of an airline booking system. Imagine you want to monitor the usage of the APIs with a metric called API Request Total (api_requests_total) which can be an instance of the counter metric type.
The following labels could come in handy:
- Code: To categorize requests based on the HTTP response code (e.g., "
200" for successful requests, "404" for not found, etc.) - Method: To differentiate requests based on the HTTP method used (e.g., "
GET," "POST," etc.) - API Name: To specify the name of the API being accessed (e.g., "
flight-api") - API Version: To track the version of the API (e.g., "
v2") - Token Name: To identify the API key used for authentication (e.g., "
my-test-token")
Example metric labels in OpenTelemetry for this use case:
- For a specific metric instance, you might have labels like {"
code": "200", "method": "GET", "api_name": "flight-api", "api_version_name": "v2", "token_name": "my-test-token"} - Another instance might have labels like {"
code": "404", "method": "POST", "api_name": "ticket-api", "api_version_name": "v1.1", "token_name": "prod-app-key"}
Now, when analyzing the example api_requests_total metric, you can gain specific insights thanks to labels:
- HTTP Code Analysis: Compare the total count of requests based on HTTP response codes to identify patterns in successful or error-prone API interactions.
- HTTP Method Distribution: Understand the distribution of requests based on HTTP methods to optimize API resources accordingly.
- API Name and Version: Monitor the usage of different APIs and versions to plan for updates, deprecations, or optimizations.
- Token Usage: Track the utilization of different API keys for authentication, identifying potential security concerns or optimizing key management.
At the end of the day, the more metrics and labels you have, the more analysis you can do.
OpenTelemetry Metrics in API Management
OpenTelemetry metrics has great potential to better observe APIs, however, the current adoption seems to lag.
Moreover, even in instances where API management solutions do offer observability features, the availability of regular metrics remains limited. Many solutions rely on user interface (UI)-based interactions, often leading to what can be termed as "ClickOps"—a reliance on manual, point-and-click operations for metric visibility. This approach, while providing some insights, falls short of the automations and cross-domain analysis promised by OpenTelemetry.
In the API management landscape, where the reliability and performance of APIs are mission-critical to the business, the gap in comprehensive observability can hinder proactive issue resolution, optimization, and strategic decision-making.
Do not fly blind!
Use Cases of OpenTelemetry Metrics in API Management
Real-Time Monitoring and Alerting
Leverage OpenTelemetry metrics to establish thresholds for vital parameters such as API response times, error rates, and request counts. This enables real-time monitoring, allowing organizations to promptly identify deviations from expected behavior.
Additionally, integrating OpenTelemetry metrics with GitOps workflows to correlate API performance changes with code deployments facilitates the swift identification of issues stemming from recent changes. This streamlines troubleshooting and ensuring the reliability of API services.
Capacity Planning and Scaling
Utilize OpenTelemetry metrics to gain comprehensive insights into resource utilization, enabling effective capacity planning. Identify bottlenecks, predict resource demands, and optimize infrastructure to meet current and future workload efficiently.
By analyzing historical OpenTelemetry metrics, organizations can forecast trends and plan for future workloads. This proactive approach ensures that API management systems are adequately prepared to handle increased demand, preventing potential performance issues.
Performance Optimization
Dive deep into OpenTelemetry metrics to identify patterns of errors and latency issues. Whether it's pinpointing error-prone API endpoints or analyzing the performance impact of specific client types, OpenTelemetry metrics provide the granularity needed for precise optimization.
OpenTelemetry Metrics in Traefik Hub
Traefik Hub showcases a wealth of OpenTelemetry metrics and labels that redefine how organizations monitor, manage, and optimize their API infrastructure. The expansive range of metrics, totaling over 20, coupled with more than 15 labels, places Traefik Hub at the forefront of empowering users with unparalleled insights.
The four key categories of metrics exposed by Traefik Hub:
- Dataflow-related metrics of exposed APIs: These metrics offer insights into the health, performance, and interactions of APIs, allowing organizations to precisely monitor and optimize the flow of data through their infrastructure.
- API management object metrics: A holistic view of key objects including but not limited to the number of APIs, users with API access on gateways published by the agent, API keys, and more. This category of metrics allows organizations to track the usage and impact of API-related objects, enabling efficient management and strategic decision-making.
- Licensing metrics for usage tracking: This category enables organizations to track their own usage against the object counts included in the license. This functionality empowers users to manage licensing efficiently, ensuring compliance while optimizing the utilization of available resources.
- Ingress-level metrics inherited from Traefik Proxy: Building upon the capabilities of Traefik Proxy, Traefik Hub inherits ingress-level metrics that provide a comprehensive understanding of network traffic patterns and behavior.
We recently enhanced our OpenTelemetry metrics by adding support for API versions, so you can stay on top of your API version proliferation. Learn more here.
Your APIs, Your Metrics, Your Tools
We don’t believe in vendor lock-in. In the quest to embrace a flexible, interoperable observability landscape, OpenTelemetry emerges as a beacon of liberation. Leveraging the rich ecosystem around OpenTelemetry not only ensures adaptability but also opens up a realm of possibilities for metric manipulation, integration, and visualization.
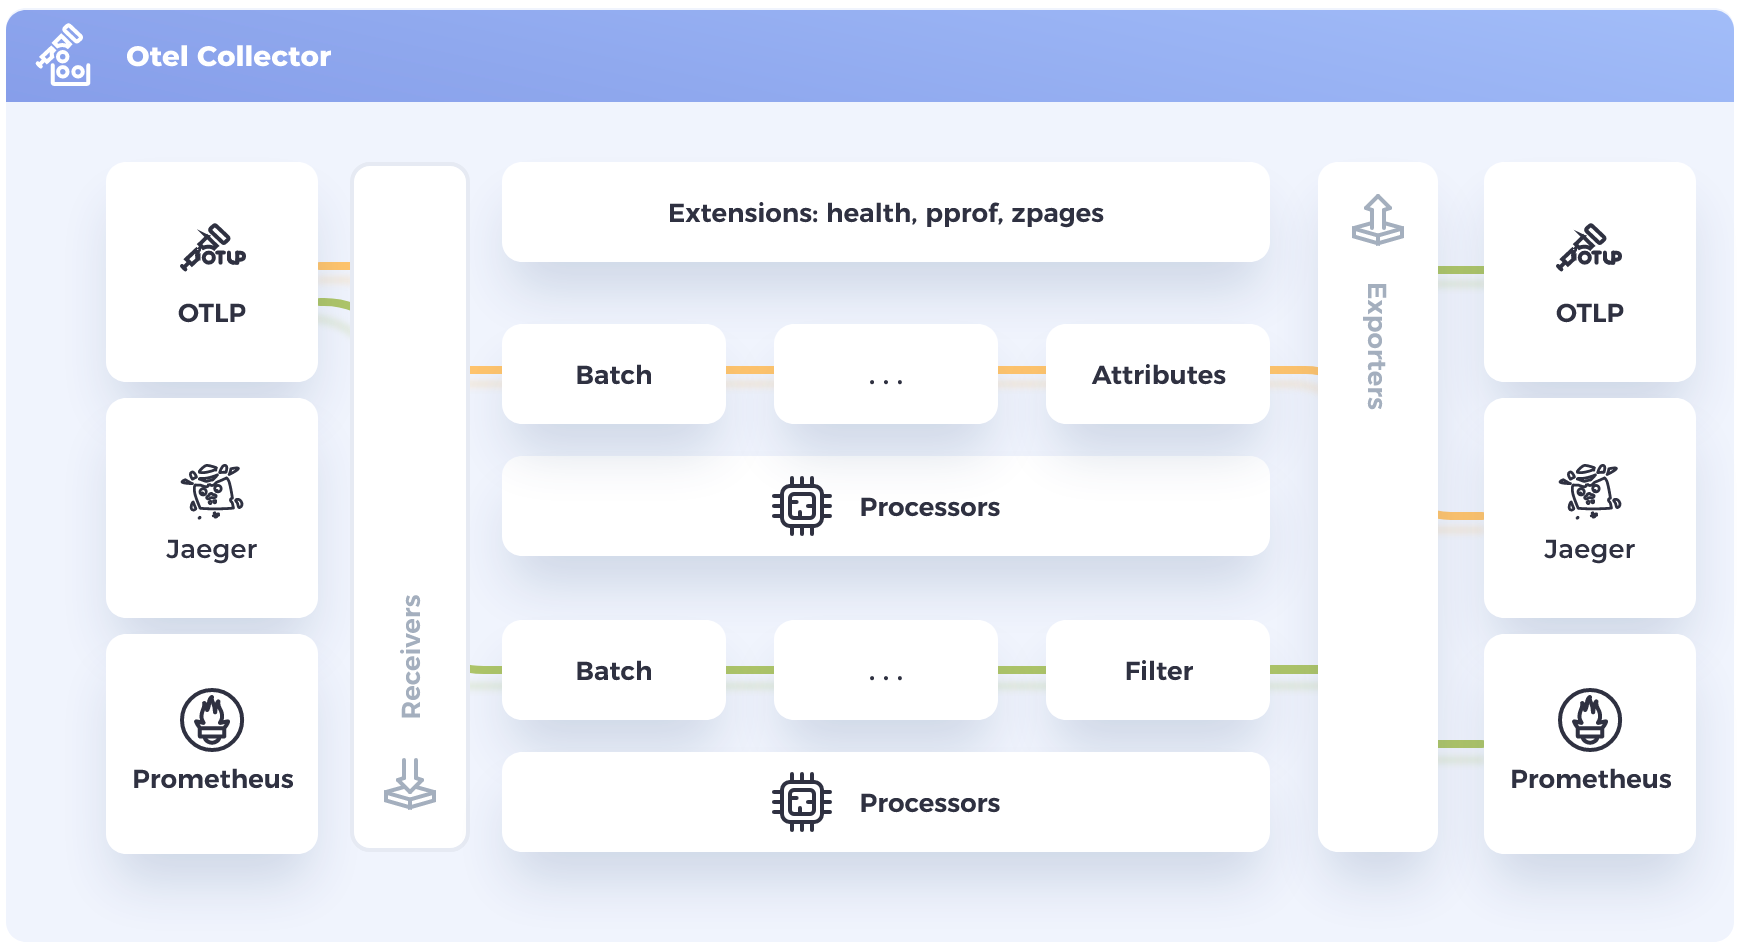
The OpenTelemetry Collector stands as a versatile tool in the arsenal of observability enthusiasts. It goes beyond collection, offering the capability to manipulate metrics dynamically. Through transformations, conversions, filtering, and enrichment, organizations can tailor their telemetry data to specific needs. This flexibility allows for seamless adaptation to evolving requirements and diverse use cases.
The latest release candidate of Prometheus marks a significant stride towards embracing open standards. With native OpenTelemetry metrics ingestion support, Prometheus becomes a part of the larger OpenTelemetry ecosystem. This integration not only simplifies the process of incorporating OpenTelemetry metrics into existing setups but also lays the foundation for a more unified and standardized observability approach usable by anyone since open-sourced.
To truly liberate observability, visualization tools play a crucial role. For example, users can leverage the full spectrum of Grafana's battle-tested features to visualize, analyze, and get insights from their APIs metrics data. Additionally, the embrace of open standards by 3rd party tools ensures that organizations are not tethered to proprietary solutions, fostering a vibrant ecosystem of choice and flexibility to cater to multiple teams and organizations needs.
Grafana Dashboards Example and Other Resources
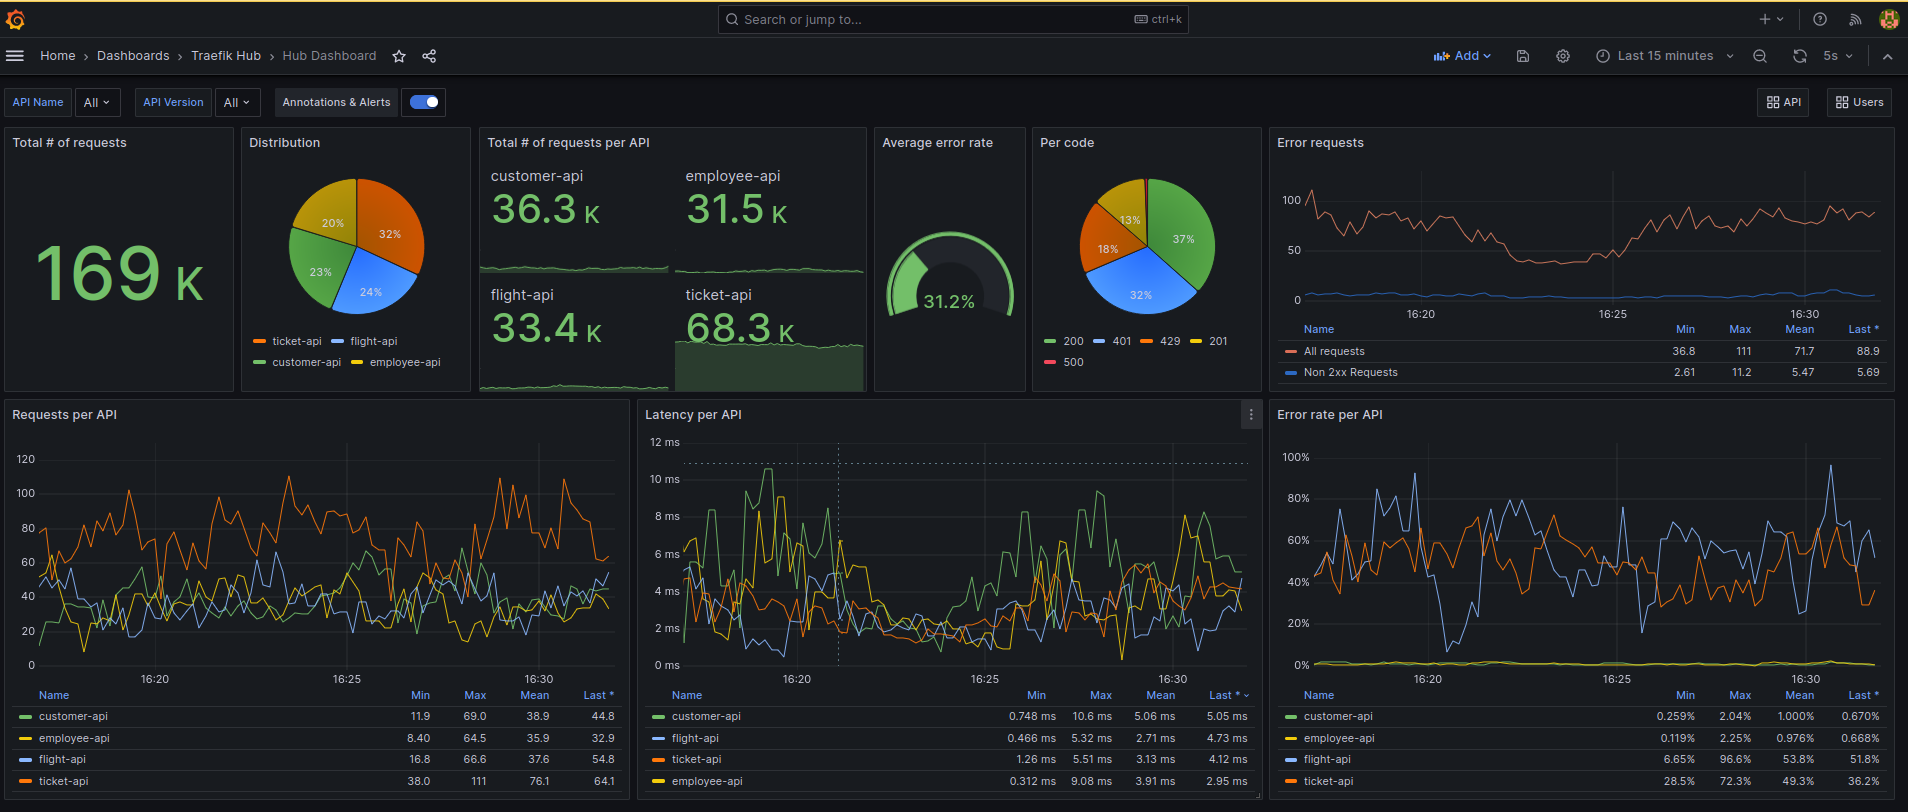
We’ve made Grafana dashboard examples that you can extend public, delivering insights with a high-level API overview, a detailed per-API, or per user-specific drill-downs.
All API Overview: Get a comprehensive overview of your entire API landscape, including traffic, response times, error rates, and more. Monitor the overall health and performance of all your APIs, enabling swift identification of global trends and anomalies and where to look deeper.
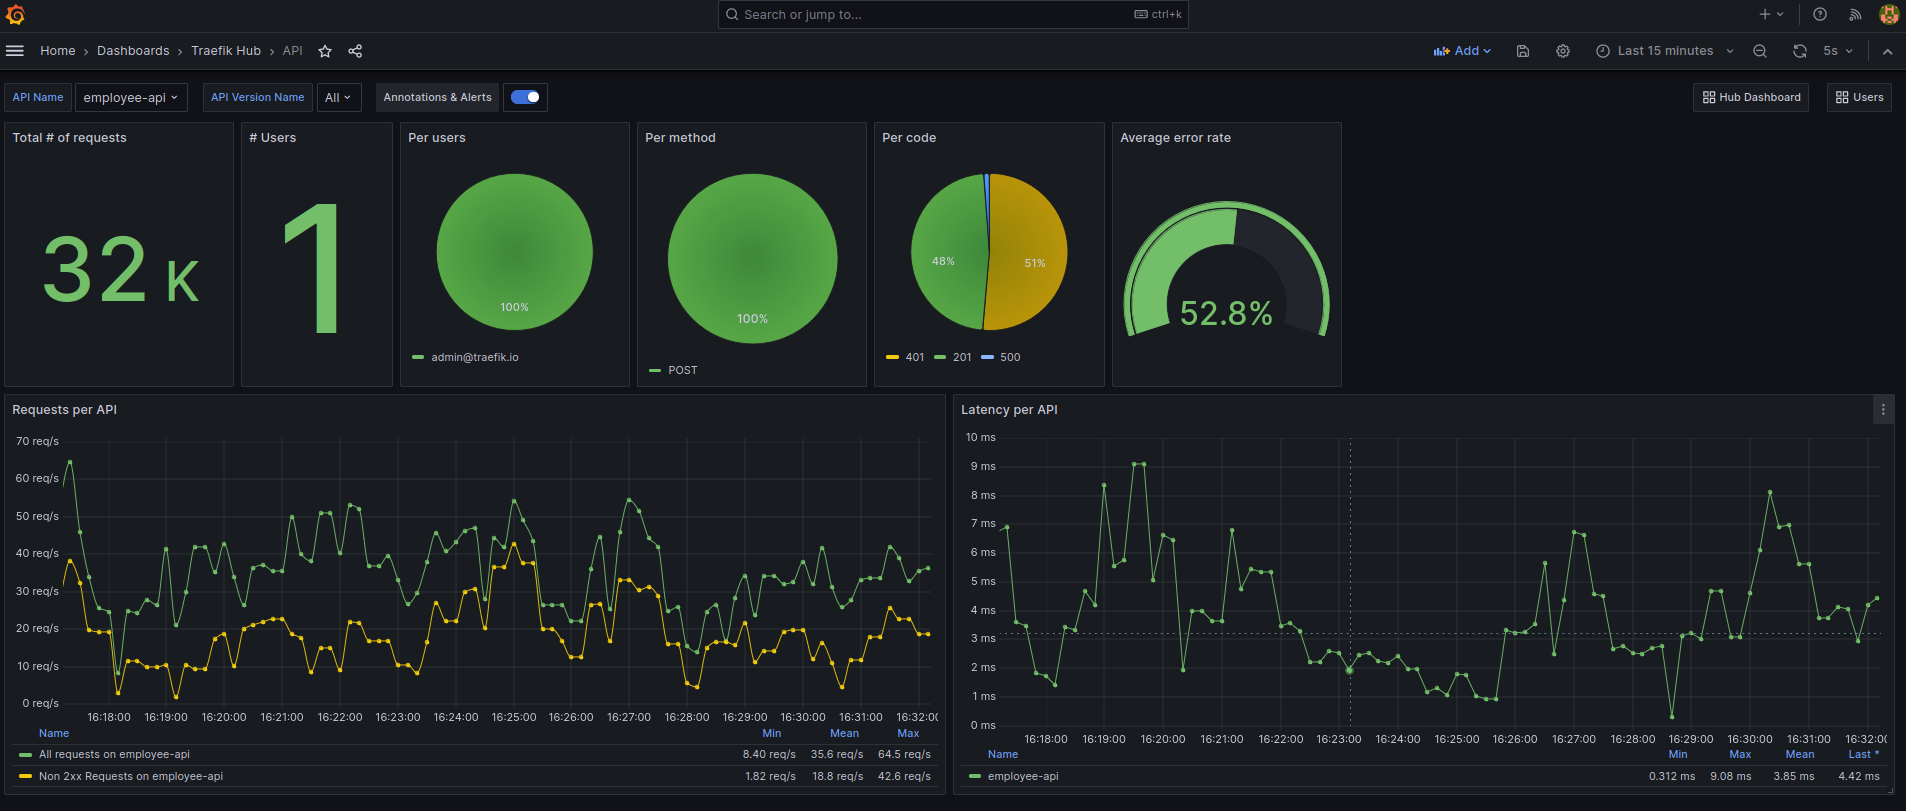
Per-API View: Dive deep into the specifics of each API, analyzing traffic patterns, latency, and error rates for targeted understanding and optimizations, with full visibility into API versions.
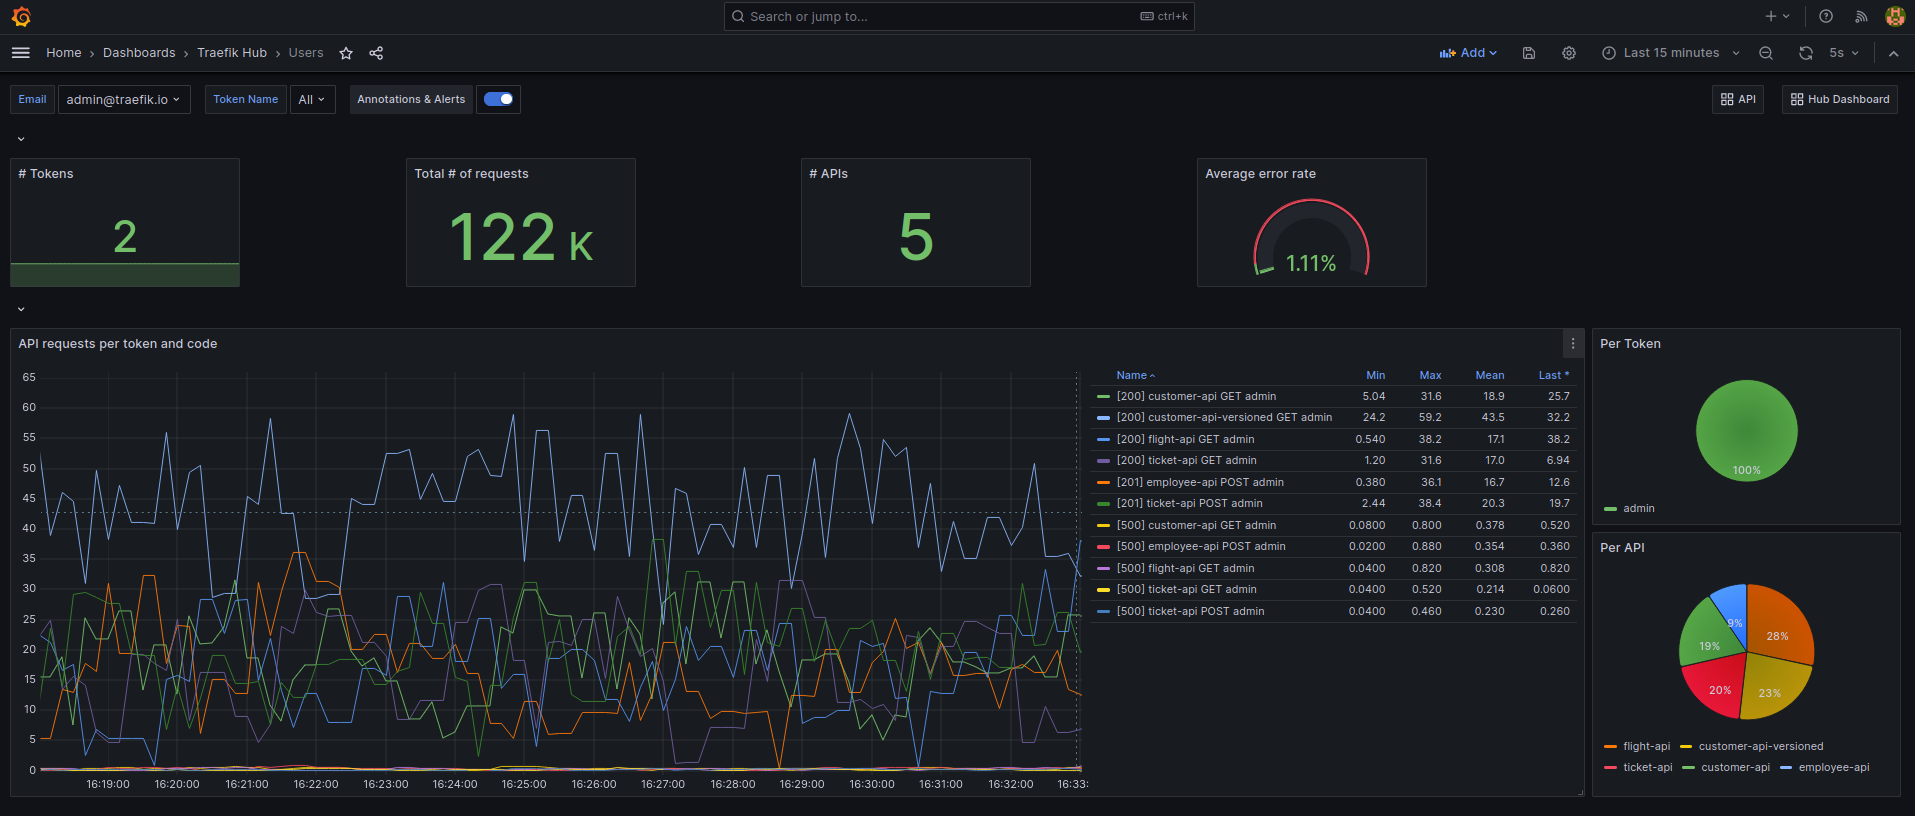
Per-User/Per-Token Drill-Down: Track the usage patterns of individual users or API tokens, gaining granular visibility into their interactions with your APIs. Analyze the usage and health of specific API consumers on API requests and responses, ensuring optimal security and resource allocation.
Kick start your observability journey with our step-by-step tutorial, incorporating the Grafana sample dashboards and our static CRD analyzer for early issue detection, embracing a GitOps approach to modernize API operations. And for in-depth information, see our documentation.
Wrapping It Up
Metrics are a key pillar of modern API observability. OpenTelemetry, thanks to its standardized approach, stands as a game-changer, providing invaluable visibility into API health, usage, and performance. Looking ahead, Traefik Hub is committed to extending OpenTelemetry to traces and logs, promising even more complete observability.


